Use of Contraception in the United States Reported in the 2017-2019 National Survey of Family Growth
Original research on the number of persons using and not using contraception in the United States, the contraceptive methods being used, and motives for using or discontinuing contraceptive methods.
Table of Contents
- 1 Introduction
- 2 Results
- 2.1 Population Size
- 2.2 Use of Contraception during Most Recent Intercourse
- 2.2.1 Reason for Nonuse
- 2.2.2 Contraception Use Rate
- 2.2.3 Sexual Inactivity
- 2.2.4 Reason for Physical Infertility Not Due to Sterilizing Procedure
- 2.2.5 Number of Methods
- 2.2.6 Method(s) Used
- 2.2.7 Method Used Exclusively
- 2.2.8 Proportion of Method Users Who Also Used Other Method(s)
- 2.2.9 Other Method(s) Used with Calendar Method
- 2.2.10 Other Method(s) Used with Withdrawal, Condom, and Pill
- 2.3 Use of Contraception during Past 12 Months
- 2.4 Consistency of Use of Contraception
- 2.5 Use of Contraceptive Methods for Other Reasons
- 2.6 Use of Contraception Ever During Lifetime
- 2.7 Discontinuation Due to Dissatisfaction
- 2.8 Reason(s) for Not Currently Using Contraception
- 2.9 Age for Female Sterilizing Operations
- 3 Discussion
- 4 Citations
- 5 Appendix A: Technical Notes
- 6 Appendix B: Supplementary Tables
- 6.1 Reason for Never Having Intercourse
- 6.2 Reason for Physical Infertility Not Due to Sterilizing Procedure
- 6.3 Method(s) Used during Most Recent Intercourse
- 6.4 Method Used Exclusively during Most Recent Intercourse
- 6.5 Proportion of Method Users Who Also Used Other Method(s) during Most Recent Intercourse
- 6.6 Other Method(s) Used with Withdrawal, Condom, and Pill during Most Recent Intercourse
- 6.7 Method(s) Used during Past 12 Months
- 6.8 Method Used Exclusively during Past 12 Months
- 6.9 Reasons for Using Pill
- 6.10 Reasons for Using Hormonal IUD
- 6.11 Use of Contraception Ever During Lifetime
- 6.12 Discontinuation Due to Dissatisfaction
- 6.13 Reason(s) for Discontinuation of Condom
- 6.14 Reason(s) for Discontinuation of Pill
- 6.15 Reason(s) for Discontinuation of IUD
- 6.16 Reason(s) for Nonuse When Not Intending to Conceive
- 6.17 Reason(s) Respondent Believes She Cannot Become Pregnant
- 7 Footnotes
1 Introduction
The purpose of this report is to describe the current state of the use of contraception in the United States. It is intended to be a preliminary report to inform subsequent analyses that pose and answer more specific questions and is therefore designed for breadth rather than depth.
1.1 Data Source
This report is based on the 2017-2019 National Survey of Family Growth (NSFG). The NSFG is a survey of a nationally representative sample of persons living in households in the United States that is designed to produce estimates of factors related to reproduction, such as sexual activity, contraceptive use, pregnancy, infertility, and childcare. It uses a probability-based, multistage sampling design based on geographic areas, housing units in selected geographic areas, and persons in selected housing units. The NSFG is administered by the National Center for Health Statistics (NCHS), but is funded and planned by several agencies within the United States Department of Health and Human Services.
Respondents who are selected for sampling and who consent to be interviewed are visited in their households by female interviewers trained specifically for the NSFG. Interviewers use laptop computers programmed with survey questionnaires and enter respondents’ answers into the laptops, using an approach known as computer-assisted personal interviewing (CAPI). Additionally, some questions of a sensitive nature are asked after the CAPI portion of the interview using audio computer-assisted self-interviews (ACASI). During the ACASI portion of the interview, respondents wear headsets to listen to prerecorded questions and enter their responses directly into the laptops.
1.1.1 Sample Characteristics
The first NSFG was done in 1973 and sampled only female persons aged 15-44 years who had ever been married. The 1982 edition of the NSFG expanded the sample to all females regardless of marital status, and the 2002 edition of the NSFG was the first to sample males in addition to females. More recently, the 2015-2017 edition of the NSFG expanded the age range for sampling from 15-44 years to 15-49 years.
In the NSFG, female respondents and male respondents are given different questionnaires, and NSFG results are provided in separate data tables for females and males with survey design information specific to the data table. Therefore, separate estimates for females and males are given throughout this report. Estimates for both females and males are only combined when no attempt is made to quantify sampling error.
The 2017-2019 edition of the NSFG has a sample size of 6,141 females and 5,206 males. The overall response rate is 63.4%, with response rates of 65.2% for females and 61.4% for males. Results are weighted to approximate the population at July 2018, the midpoint of sampling. The sampled population is persons aged 15-49 living in households in the United States and includes neither those without a current residential address nor those living in group housing, such as military bases, correctional facilities, etc. However, the population does include college students living in dormitories by way of their parents’ households.
1.1.2 Sexes of Sexual Partners
Use of contraceptive methods for the purpose of contraception per se is only relevant for sexual intercourse with the opposite sex, though, as seen in Section 2.5, contraceptive methods are sometimes used for other purposes than contraception. Therefore, the NSFG and this report focus extensively on sexual intercourse between individuals of opposite sex. All mentions of sexual activity in this report should be interpreted to refer to sexual intercourse with someone of the opposite sex unless stated otherwise.
1.1.3 Disclosure Risk Reduction
Before the NSFG public use data files are released, actions are taken in order to reduce the risk that a specific respondent can be personally identified based on the information to be contained therein. This disclosure risk reduction can be as severe as suppressing certain variables from the public use data files entirely, though many variables are merely modified to be less specific. For instance, while respondents are asked about the month and year that pregnancies begin and end in the NSFG, only the year that pregnancies begin and end are available in the public use data files.
This report is based entirely on the NSFG public use data files. Whenever analysis is constrained in some way by the disclosure risk reduction, this is noted in the report.
1.1.4 Documentation
More information about the NSFG is available in its official User’s Guide and appendices (National Center for Health Statistics 2020c), the Summary of Design and Data Collection (National Center for Health Statistics 2020e), and its more detailed design documentation (National Center for Health Statistics 2020a, 2020b, 2020d).
1.2 Differences with Prior Works
There are prior works based on the NSFG about the same subject as this report. (Kavanaugh and Jerman 2018) Indeed, personnel associated with the NCHS themselves publish reports based on the NSFG in journals (Piccinino and Mosher 1998), National Health Statistics Reports (Jones 2012; Daniels, Mosher, and Jones 2013; Copen 2017), and NCHS Data Briefs (Daniels and Abma 2020). This report differs from prior works in several ways:
- Most notably, many prior works based on the NSFG focus exclusively on contraceptive use among females living in the United States. (Piccinino and Mosher 1998; Jones 2012; Daniels, Mosher, and Jones 2013; Kavanaugh and Jerman 2018; Daniels and Abma 2020) This report examines contraceptive use reported by both females and males and includes results for males alongside results for females, wherever data is available in both NSFG data files.1
- Unlike many prior works based on past editions of the NSFG, this report is based on the latest 2017-2019 edition of the NSFG. While several academic papers on more specific topics based on the 2017-2019 data are published in the literature at the time of the writing of this report, only a single NCHS Data Brief covers contraceptive use in a similarly broad way using the 2017-2019 NSFG. (Daniels and Abma 2020)
- Much analysis of contraceptive use based on the NSFG is based on contraceptive status as encoded in the
CONSTATseries of variables in the public use data files. (Jones 2012; Kavanaugh and Jerman 2018; Daniels and Abma 2020) Contraceptive status is based on respondents’ answer to the question of what contraceptive method(s) they are using in the month they are interviewed. This report differs from this trend by focusing analysis on method(s) of contraception reported used during respondents’ most recent sexual intercourse. The reasons for this are discussed further in Section 5.1. - Prior analysis using contraceptive status often categorizes respondents only by the most effective contraceptive method they mention using. (Piccinino and Mosher 1998; Jones 2012; Kavanaugh and Jerman 2018; Daniels and Abma 2020) This report differs from this practice by exploring the simultaneous use of multiple methods of contraception.
- Prior works often include analysis of contraceptive use by demographic or background covariates – such as age, education, income, racial categorization, or ethnic background – and in terms of more proximal reproductive covariates – such as parity (number of existing children) or intentions for future children. (Piccinino and Mosher 1998; Jones 2012; Kavanaugh and Jerman 2018; Daniels and Abma 2020) This report leaves such covariate-based analysis to further research, with the exception that it contains some descriptive statistics using age as a covariate in order to facilitate discussion of observed differences in contraceptive use reporting between females and males. (Section 3.1)
- Similarly, while many prior works focus on discussing trends in how contraceptive use changes over time (Piccinino and Mosher 1998; Jones 2012; Kavanaugh and Jerman 2018), this report leaves trend analysis to further research.
- Finally, this report broadly covers in one report several topics that are discussed in individual prior works, such as methods of contraception ever used (Daniels, Mosher, and Jones 2013) or consistency of condom use (Copen 2017).
1.3 Source Code and License
Analysis for this report is done using the R statistical programming language. (R Core Team 2022) Estimates handling the NSFG’s sampling weights and complex sampling design pseudo-structure are made using the survey package. (Lumley 2021)
The source code for this report and all supporting source code are available in a public GitHub repository. This report and supporting source code are licensed under Creative Commons Attribution 4.0 International (CC BY 4.0) license. Anyone is free to share and adapt the material contained here as long as appropriate credit is given, a link to the license is provided, and any changes made are indicated.
2 Results
Sections 2.2 and 2.5 pertain to what contraceptive method(s) were used during the sexual intercourse that occurred most recently before the respondents’ interviews. Sections 2.3 and 2.4 focus on contraceptive use over the 12 months preceding the interview. Sections 2.6 and 2.7 pertain to contraceptive use ever during the lifetime of respondents. Section 2.8 pertains to contraceptive use reported in the month of the interview.
2.1 Population Size
| Total | |||
|---|---|---|---|
| Est. | 95% C.I. | ||
| Females | 72.67M | (65.61M, 79.73M) | |
| Males | 72.22M | (64.44M, 80.00M) | |
Based on the NSFG, there is an estimated 72.67M females2 and 72.22M males living in households in the United States. (Table 2.1)3 According to census data, there are 73,874,470 females and 74,595,017 males living in the United States.4 (U.S. Census Bureau 2010) The 95% confidence intervals of the NSFG-based estimates of population size cover the census-based counts. Thus, the NSFG estimates of population size are consistent with known population sizes.5
2.2 Use of Contraception during Most Recent Intercourse
| Total | Percentage | ||||
|---|---|---|---|---|---|
| Est. | 95% C.I. | Est. | 95% C.I. | ||
| Females | Did not have intercourse | 21.4M | (19.4M, 23.4M) | 29.4% | (27.4%, 31.5%) |
| Had intercourse | 51.3M | (45.5M, 57.1M) | 70.6% | (68.5%, 72.6%) | |
| Males | Did not have intercourse | 23.2M | (19.8M, 26.6M) | 32.1% | (29.5%, 34.8%) |
| Had intercourse | 49.0M | (43.7M, 54.3M) | 67.9% | (65.2%, 70.5%) | |
The estimates in this section pertain to a subdomain of persons in the United States who had intercourse with someone of the opposite sex in the past 3 months. There are approximately 51.3M females and 49.0M males in this subdomain. (Table 2.2)
| Total | Percentage | ||||
|---|---|---|---|---|---|
| Est. | 95% C.I. | Est. | 95% C.I. | ||
| Females | Did not use contraception | 9.13M | (7.80M, 10.47M) | 17.8% | (15.8%, 19.8%) |
| Used contraception | 42.15M | (37.14M, 47.17M) | 82.2% | (80.2%, 84.2%) | |
| Males | Did not use contraception | 11.02M | (9.32M, 12.72M) | 22.5% | (20.3%, 24.7%) |
| Used contraception | 38.00M | (33.90M, 42.09M) | 77.5% | (75.3%, 79.7%) | |
Over three quarters of persons sexually active with the opposite sex used at least one method of contraception during their most recent intercourse, and a slightly greater proportion of females report using contraception than males. (Table 2.3)
2.2.1 Reason for Nonuse
| Total | Percentage | ||||
|---|---|---|---|---|---|
| Est. | 95% C.I. | Est. | 95% C.I. | ||
| Females | Pregnant in month of last intercourse | 1.95M | (1.55M, 2.36M) | 21.4% | (18.2%, 24.5%) |
| Postpartum | 0.03M | (0.00M, 0.05M) | 0.3% | (0.0%, 0.5%) | |
| Currently trying to conceive | 2.94M | (2.38M, 3.50M) | 32.2% | (27.4%, 36.9%) | |
| Physically infertile not due to sterilizing procedure | 0.37M | (0.20M, 0.54M) | 4.0% | (2.0%, 6.0%) | |
| Last intercourse was with partner who is physically infertile not due to sterilizing procedure | 0.16M | (-0.01M, 0.33M) | 1.8% | (-0.1%, 3.6%) | |
| Otherwise did not use contraception during last intercourse | 3.69M | (2.84M, 4.53M) | 40.4% | (34.3%, 46.4%) | |
| Males | Last intercourse was with partner who is pregnant | 1.64M | (1.13M, 2.15M) | 14.9% | (10.6%, 19.2%) |
| Last intercourse was with partner who is trying to conceive | 2.62M | (2.01M, 3.23M) | 23.8% | (19.6%, 28.0%) | |
| Physically infertile not due to sterilizing procedure | 0.23M | (0.11M, 0.36M) | 2.1% | (1.0%, 3.2%) | |
| Last intercourse was with partner who is physically unable to conceive | 0.70M | (0.33M, 1.08M) | 6.4% | (3.2%, 9.5%) | |
| Otherwise did not use contraception during last intercourse | 5.82M | (4.72M, 6.93M) | 52.9% | (47.4%, 58.3%) | |
Some persons intentionally refrain from using contraception for various reasons. The most common reason for intentional nonuse of contraception is a desire to conceive a pregnancy, followed by the female partner currently being pregnant. (Table 2.4)
The “otherwise did not use contraception during last intercourse” category in Table 2.4 estimates those who are at increased risk for unintended pregnancy due contraceptive nonuse.
“Postpartum” is categorized separately in Table 2.4 for females, but not for males because this information is not available in the public use data files for males due to disclosure risk reduction. “Otherwise did not use contraception during last intercourse” for males therefore includes some persons who last had intercourse with a postpartum female. However, as can be gleaned from the estimates for females, this is a small number of persons.
The “physically infertile not due to sterilizing procedure” category is explored in Section 2.2.4.
2.2.2 Contraception Use Rate
| Total | Percentage | ||||
|---|---|---|---|---|---|
| Est. | 95% C.I. | Est. | 95% C.I. | ||
| Females | Used at least one contraceptive method during last intercourse | 42.18M | (37.16M, 47.20M) | 92.0% | (90.4%, 93.5%) |
| Otherwise did not use contraception during last intercourse | 3.69M | (2.84M, 4.53M) | 8.0% | (6.5%, 9.6%) | |
| Males | Used at least one contraceptive method during last intercourse | 38.00M | (33.90M, 42.09M) | 86.7% | (84.8%, 88.6%) |
| Otherwise did not use contraception during last intercourse | 5.82M | (4.72M, 6.93M) | 13.3% | (11.4%, 15.2%) | |
Combining the estimates from Table 2.3 and Table 2.4, an overall contraceptive use rate can be calculated with the number of persons using contraception in the numerator and the number persons at risk for unintended pregnancy in the denominator. Those “at risk for unintended pregnancy” refers to persons who had sexual intercourse with someone of the opposite sex in past 3 months and are not themselves nor had intercourse with a partner who is intending to become pregnant, currently pregnant, postpartum, or physically infertile.
Generally, the contraceptive use rate is high, though this still leaves several million persons at increased risk for unintended pregnancy due to contraceptive nonuse. (Table 2.5)
The reported contraceptive use rate is higher for females than for males. A chi-squared test of independence with second-order Rao-Scott adjustment is statistically significant \((p = 0.0048)\). Therefore, there is sufficient evidence to conclude that a person’s sex and reported contraception use during last intercourse are dependent, and the difference in contraception use rates between females and males in Table 2.5 is not attributable to sampling error.
2.2.2.1 Reported Ignorance of Contraceptive Use
The contraceptive use rate is greater for females than males. (Table 2.5) However, one factor that might decrease the rate at which males report contraceptive use is that some males do not know that their partners are using contraception.
| Total | Percentage | |||
|---|---|---|---|---|
| Est. | 95% C.I. | Est. | 95% C.I. | |
| Does not report ignorance of partner's contraceptive use | 46.12M | (41.22M, 51.02M) | 94.1% | (93.0%, 95.1%) |
| Ignorant of partner's contraceptive use | 2.90M | (2.24M, 3.55M) | 5.9% | (4.9%, 7.0%) |
A small proportion of sexually active males report not knowing if their partner used contraception during their last intercourse. However, the estimates of Table 2.6 are based on two types of questions:
- questions about partners’ use of contraception, or
- questions specifically asking respondents whether their partners could have used contraception without their knowledge.
Respondents are counted in the “ignorant of partner’s contraceptive use” category for the estimates of Table 2.6 if they respond “don’t know” to the first type of question or if they respond “yes” or “don’t know” to the second type of question. However, the second type of question is only asked of NSFG respondents who are neither married nor cohabitating. Therefore, these results should be interpreted with care. This is discussed further in Section 3.1.
2.2.3 Sexual Inactivity
| Total | Percentage | ||||
|---|---|---|---|---|---|
| Est. | 95% C.I. | Est. | 95% C.I. | ||
| Females | Had intercourse | 12.68M | (11.33M, 14.03M) | 59.3% | (56.2%, 62.4%) |
| Never have had intercourse | 8.70M | (7.66M, 9.75M) | 40.7% | (37.6%, 43.8%) | |
| Males | Had intercourse | 13.28M | (11.27M, 15.30M) | 57.2% | (53.9%, 60.5%) |
| Never have had intercourse | 9.92M | (8.20M, 11.64M) | 42.8% | (39.5%, 46.1%) | |
Among persons who have not had intercourse with someone of the opposite sex in the past 3 months, a sizable minority have never had intercourse with someone of the opposite sex. (Table 2.7)
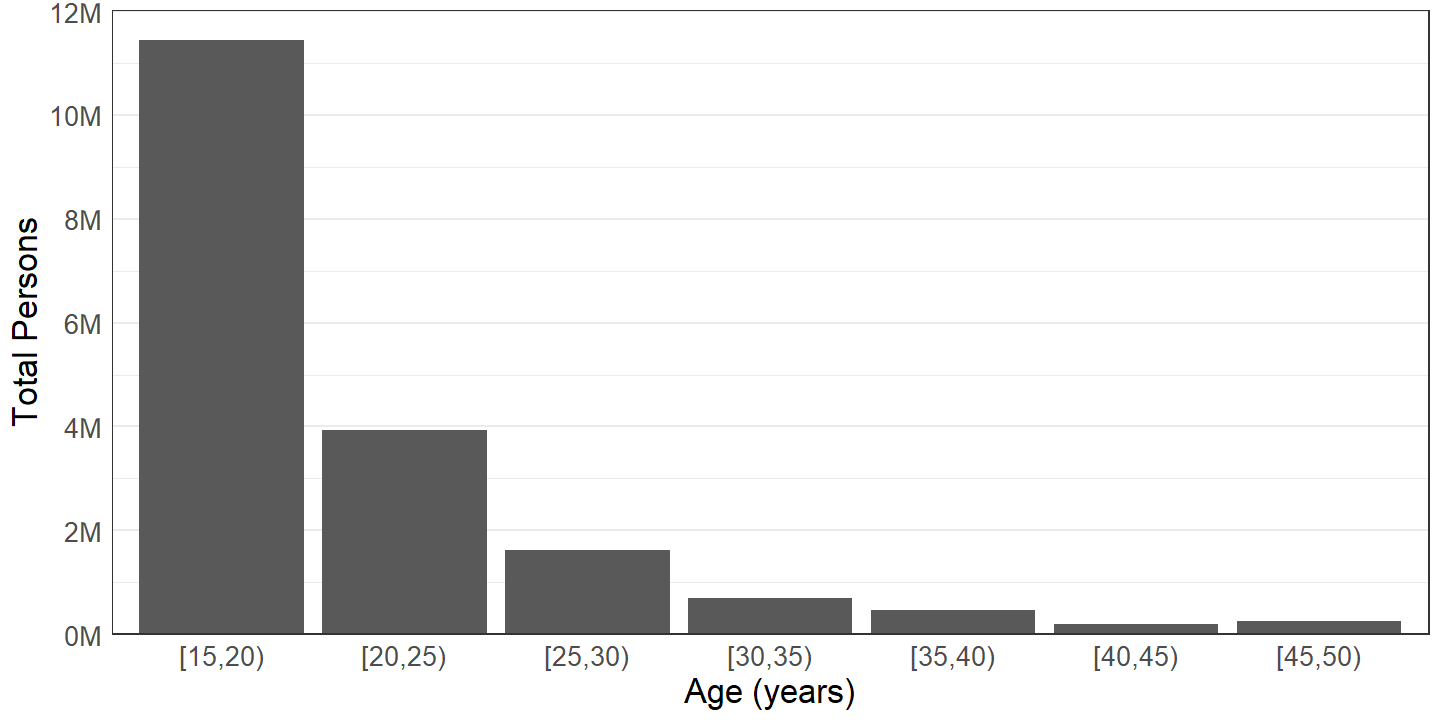
Figure 2.1: Persons who have never had sexual intercourse with the opposite sex by age group.
Most persons who have never had sexual intercourse with someone of the opposite sex are in younger age groups, and totals of persons who have never had sexual intercourse decrease with increasing age. (Figure 2.1)
2.2.3.1 Reason for Never Having Intercourse
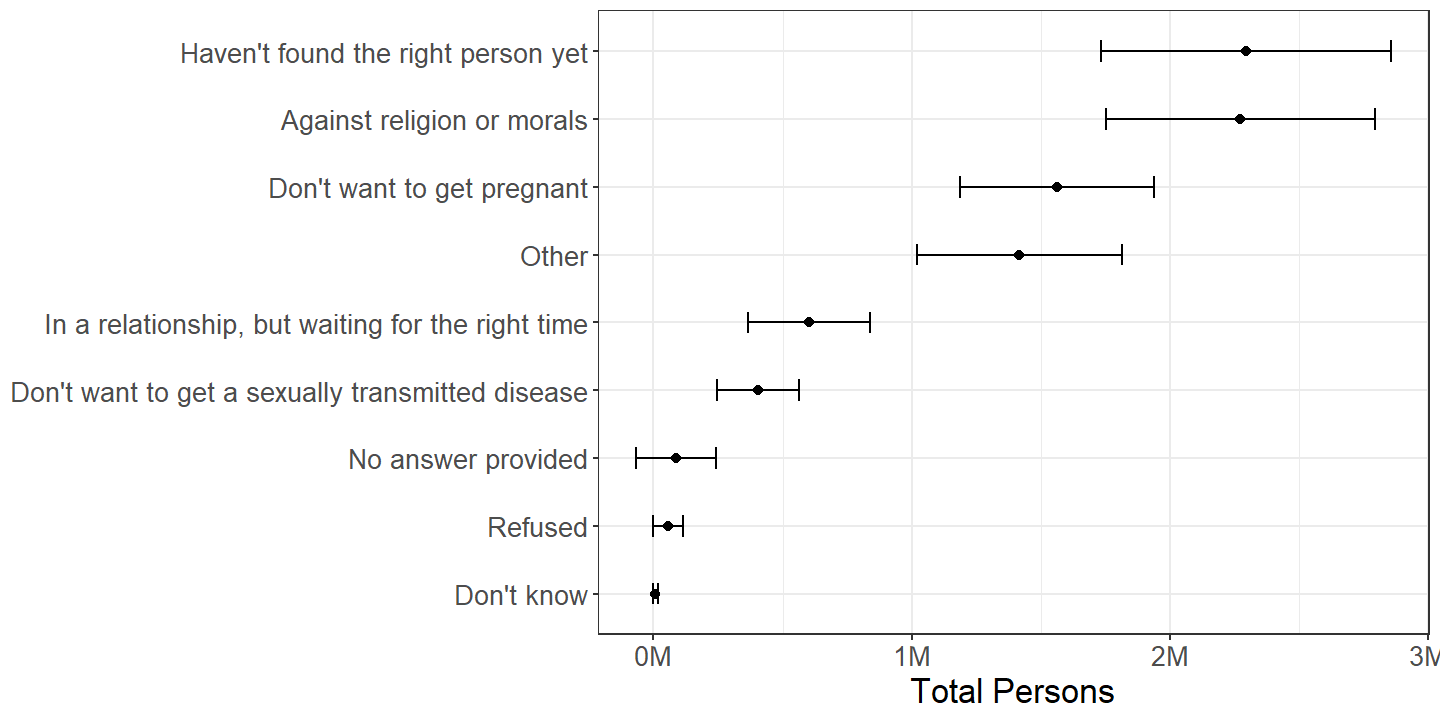
Figure 2.2: Females by reason for not having had sexual intercourse with the opposite sex, among those who have not. Dots represent point estimates and brackets represent 95% confidence intervals.
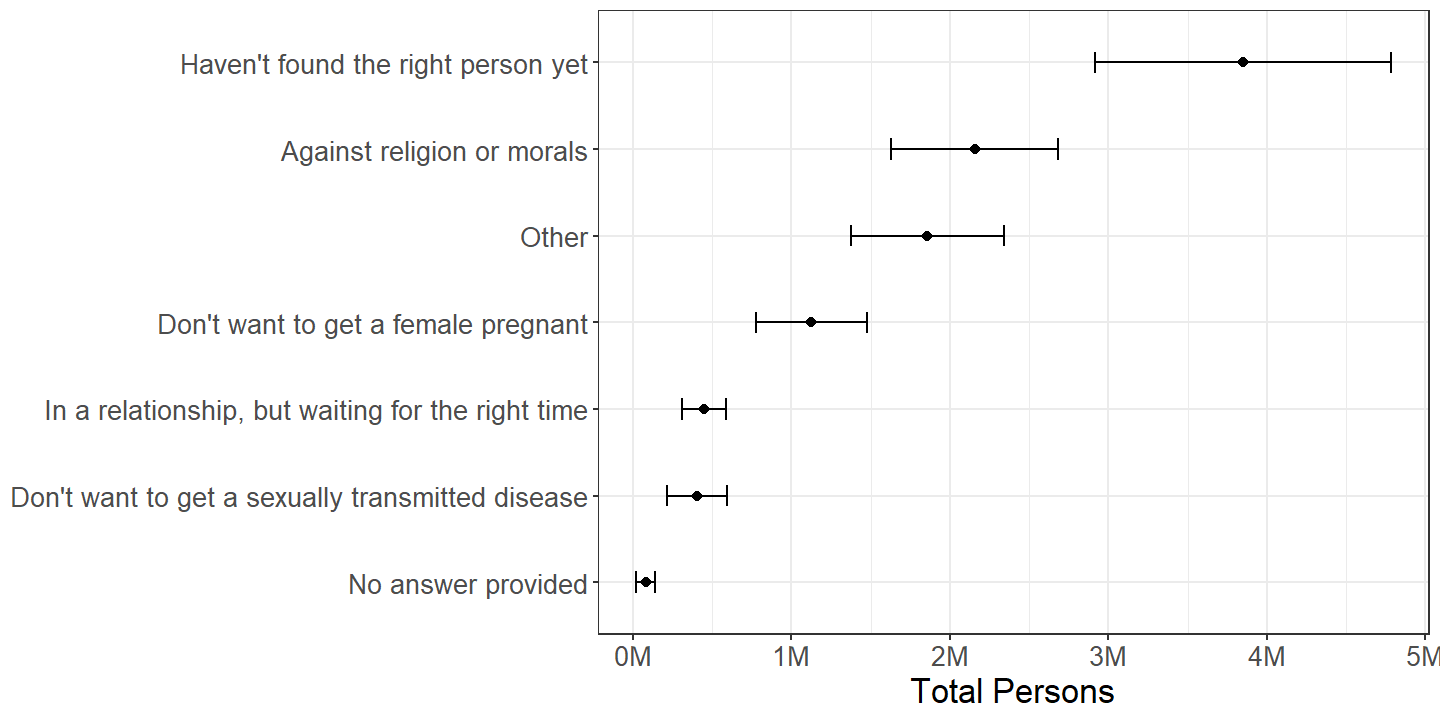
Figure 2.3: Males by reason for not having had sexual intercourse with the opposite sex, among those who have not. Dots represent point estimates and brackets represent 95% confidence intervals.
Many persons who have not had intercourse with someone of the opposite sex report “haven’t found the right person yet” as a reason, though this appears to be more common for males than for females. “Against religion or morals” is another commonly cited reason. It is notable that “other” is also a popular reason chosen for not having had intercourse with someone of the opposite sex. (Figures 2.2 and 2.3) This is indirectly explored in the subsequent Section 2.2.3.2.
2.2.3.2 Attraction by Sex
| Had intercourse with male in past 3 months | Did not have intercourse with male in past 3 months | |||||||
|---|---|---|---|---|---|---|---|---|
| Total | Percentage | Total | Percentage | |||||
| Est. | 95% C.I. | Est. | 95% C.I. | Est. | 95% C.I. | Est. | 95% C.I. | |
| Only attracted to males | 38.32M | (34.32M, 42.33M) | 74.7% | (71.4%, 78.1%) | 14.46M | (12.80M, 16.11M) | 67.6% | (64.3%, 70.9%) |
| Mostly attracted to males | 8.56M | (6.67M, 10.46M) | 16.7% | (14.0%, 19.4%) | 2.56M | (2.12M, 3.00M) | 12.0% | (9.9%, 14.0%) |
| Equally attracted to males and females | 3.13M | (2.41M, 3.85M) | 6.1% | (5.0%, 7.2%) | 1.51M | (1.14M, 1.87M) | 7.0% | (5.3%, 8.7%) |
| Mostly attracted to females | 0.26M | (0.05M, 0.47M) | 0.5% | (0.1%, 0.9%) | 1.05M | (0.74M, 1.36M) | 4.9% | (3.6%, 6.2%) |
| Only attracted to females | 0.12M | (0.01M, 0.22M) | 0.2% | (0.0%, 0.4%) | 0.94M | (0.67M, 1.20M) | 4.4% | (3.2%, 5.6%) |
| Not sure | 0.47M | (0.26M, 0.69M) | 0.9% | (0.5%, 1.3%) | 0.59M | (0.34M, 0.83M) | 2.7% | (1.6%, 3.9%) |
| Not ascertained | 0.11M | (0.00M, 0.21M) | 0.2% | (0.0%, 0.4%) | 0.07M | (-0.04M, 0.18M) | 0.3% | (-0.2%, 0.8%) |
| Refused | 0.21M | (0.05M, 0.37M) | 0.4% | (0.1%, 0.7%) | 0.22M | (0.08M, 0.36M) | 1.0% | (0.4%, 1.7%) |
| Don't know | 0.10M | (0.02M, 0.19M) | 0.2% | (0.0%, 0.4%) | 0.00M | (-0.00M, 0.01M) | 0.0% | (-0.0%, 0.0%) |
| Total | 51.29M | (45.52M, 57.05M) | 21.38M | (19.41M, 23.36M) | ||||
Among females who have had sexual intercourse with a male in the past 3 months, approximately 0.5% describe themselves as “mostly attracted to females” and 0.2% as “only attracted to females.” However, among those that have not had intercourse with a male in the past 3 months, 4.9% describe themselves as “mostly attracted to females” and 4.4% as “only attracted to females.” An adjusted Wald-Koch chi-squared test of homogeneity of proportions is statistically significant \((p = 2.2\times 10^{-9})\). Therefore, the differences in proportions in Table 2.8 of persons categorized by attraction between those sexually active with males in the past 3 months and those not sexually active with males are not attributable to sampling error.
| Had intercourse with female in past 3 months | Did not have intercourse with female in past 3 months | |||||||
|---|---|---|---|---|---|---|---|---|
| Total | Percentage | Total | Percentage | |||||
| Est. | 95% C.I. | Est. | 95% C.I. | Est. | 95% C.I. | Est. | 95% C.I. | |
| Only attracted to females | 45.29M | (40.44M, 50.13M) | 92.4% | (91.0%, 93.8%) | 18.46M | (15.56M, 21.36M) | 79.5% | (76.4%, 82.6%) |
| Mostly attracted to females | 2.50M | (1.85M, 3.16M) | 5.1% | (3.9%, 6.3%) | 1.58M | (1.09M, 2.07M) | 6.8% | (4.9%, 8.7%) |
| Equally attracted to females and males | 0.40M | (0.12M, 0.69M) | 0.8% | (0.3%, 1.4%) | 0.51M | (0.27M, 0.75M) | 2.2% | (1.2%, 3.2%) |
| Mostly attracted to males | 0.03M | (-0.00M, 0.06M) | 0.1% | (-0.0%, 0.1%) | 0.41M | (0.24M, 0.59M) | 1.8% | (1.0%, 2.6%) |
| Only attracted to males | 0.04M | (-0.00M, 0.08M) | 0.1% | (-0.0%, 0.2%) | 1.50M | (1.09M, 1.90M) | 6.4% | (4.7%, 8.2%) |
| Not sure | 0.34M | (0.15M, 0.53M) | 0.7% | (0.3%, 1.1%) | 0.56M | (0.24M, 0.89M) | 2.4% | (1.2%, 3.7%) |
| Not ascertained | 0.08M | (0.02M, 0.15M) | 0.2% | (0.0%, 0.3%) | 0.03M | (-0.00M, 0.05M) | 0.1% | (-0.0%, 0.2%) |
| Refused | 0.33M | (0.14M, 0.52M) | 0.7% | (0.3%, 1.1%) | 0.16M | (0.07M, 0.25M) | 0.7% | (0.3%, 1.1%) |
| Don't know | 0.00M | (-0.00M, 0.01M) | 0.0% | (-0.0%, 0.0%) | 0.00M | (0.00M, 0.00M) | 0.0% | (0.0%, 0.0%) |
| Total | 49.02M | (43.73M, 54.31M) | 23.20M | (19.80M, 26.61M) | ||||
Similarly, the proportion of males who are “only attracted to females” is approximately 92.4% among those who have had intercourse with a female in the past 3 months, but only 79.5% among those who have not, and the proportion “only attracted to males” is approximately 0.1% among those who had intercourse with a female in the past 3 months, but is 6.4% among those who have not. An adjusted Wald-Koch chi-squared test of homogeneity of proportions is again statistically significant \((p = 3\times 10^{-9})\), and the differences in Table 2.9 in proportions of persons categorized by attraction between those sexually active with males in the past 3 months and those not sexually active with a male in the past 3 months are not due to sampling error.
Thus, some persons who are not sexually active with the opposite sex are simply not attracted to the opposite sex, such as the approximately 1.5M males only attracted to males who did not have intercourse with a female in the past 3 months in Table 2.9.
2.2.4 Reason for Physical Infertility Not Due to Sterilizing Procedure
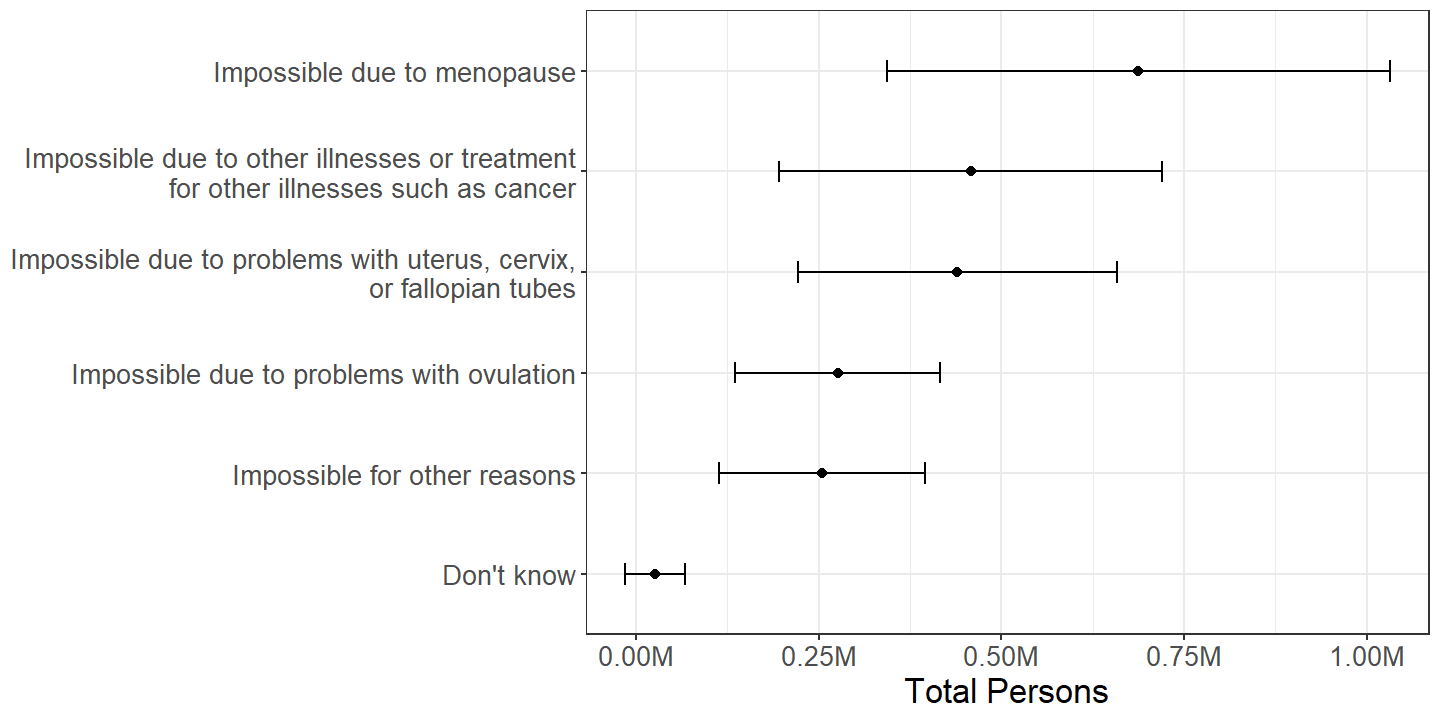
Figure 2.4: Females by reason reported for their inability to become pregnant, among those who report being physically infertile not due to a sterilizing procedure.
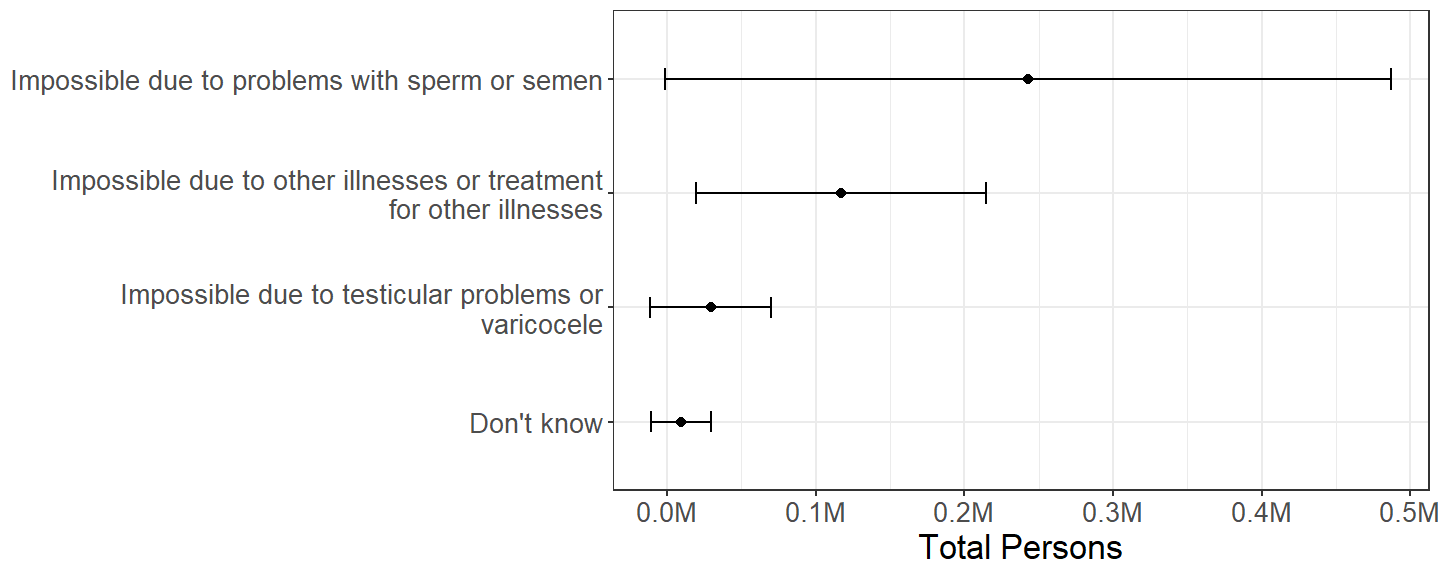
Figure 2.5: Females by reason reported for their partners’ inability to father a child, among those who report having a partner who is physically infertile not due to a sterilizing procedure.
The reason for physical infertility not due to a sterilizing procedure is part of the questionnaire for female respondents of the NSFG, but not the questionnaire for male respondents. As Figures 2.4 and 2.5 illustrate, because these conditions are relatively rare, the effective sample sizes of the relevant subdomains from a two-year sequence of the NSFG are small, and the sampling error is quite large relative to the estimates.
2.2.5 Number of Methods
| Total | Percentage | ||||
|---|---|---|---|---|---|
| Est. | 95% C.I. | Est. | 95% C.I. | ||
| Females | 1 | 34.20M | (30.26M, 38.14M) | 81.1% | (79.0%, 83.2%) |
| 2 | 7.60M | (6.19M, 9.00M) | 18.0% | (16.0%, 20.1%) | |
| 3 | 0.38M | (0.18M, 0.58M) | 0.9% | (0.4%, 1.4%) | |
| Males | 1 | 29.56M | (26.16M, 32.97M) | 77.8% | (75.2%, 80.4%) |
| 2 | 7.67M | (6.41M, 8.92M) | 20.2% | (17.5%, 22.8%) | |
| 3 | 0.68M | (0.41M, 0.96M) | 1.8% | (1.1%, 2.5%) | |
| 4 | 0.09M | (-0.03M, 0.20M) | 0.2% | (-0.1%, 0.5%) | |
While the vast majority of both females and males used only one method of contraception during their last intercourse, a substantial minority of persons used multiple methods. (Table 2.10)
2.2.6 Method(s) Used
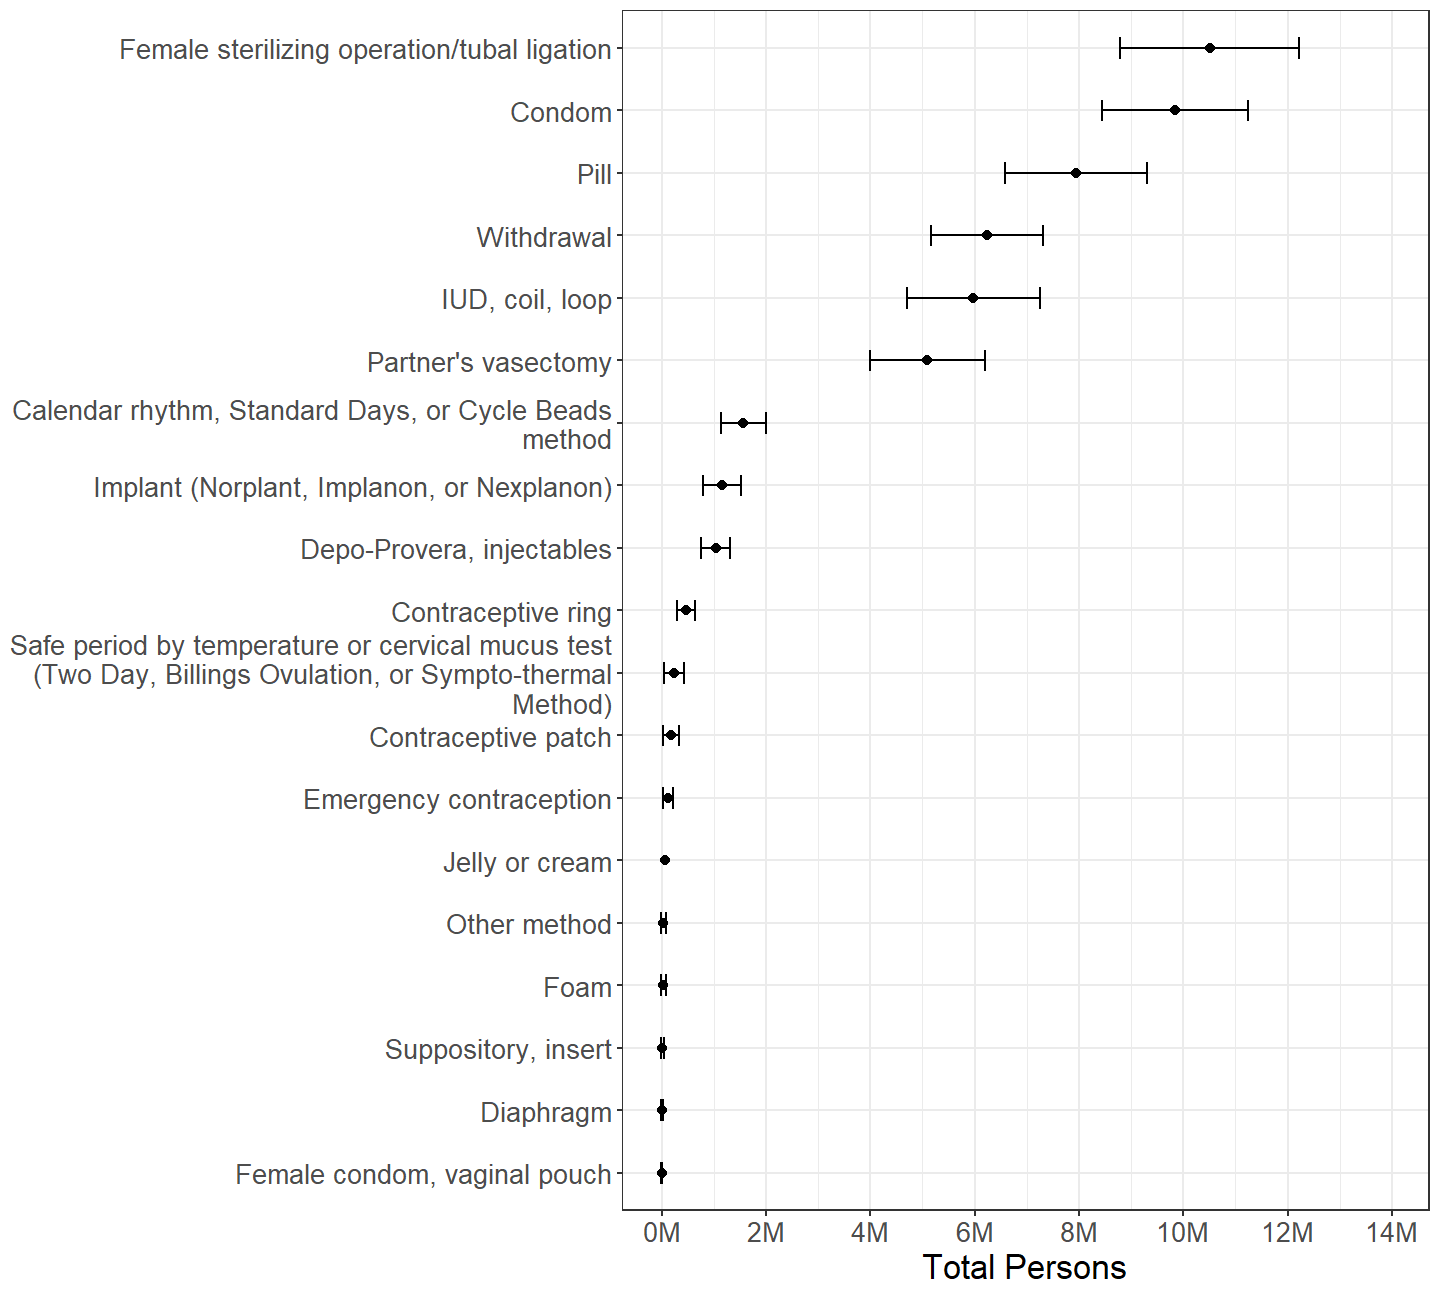
Figure 2.6: Females categorized by whether or not each contraceptive method was used during last intercourse with a male in the past 3 months, with persons using multiple methods counted multiple times.
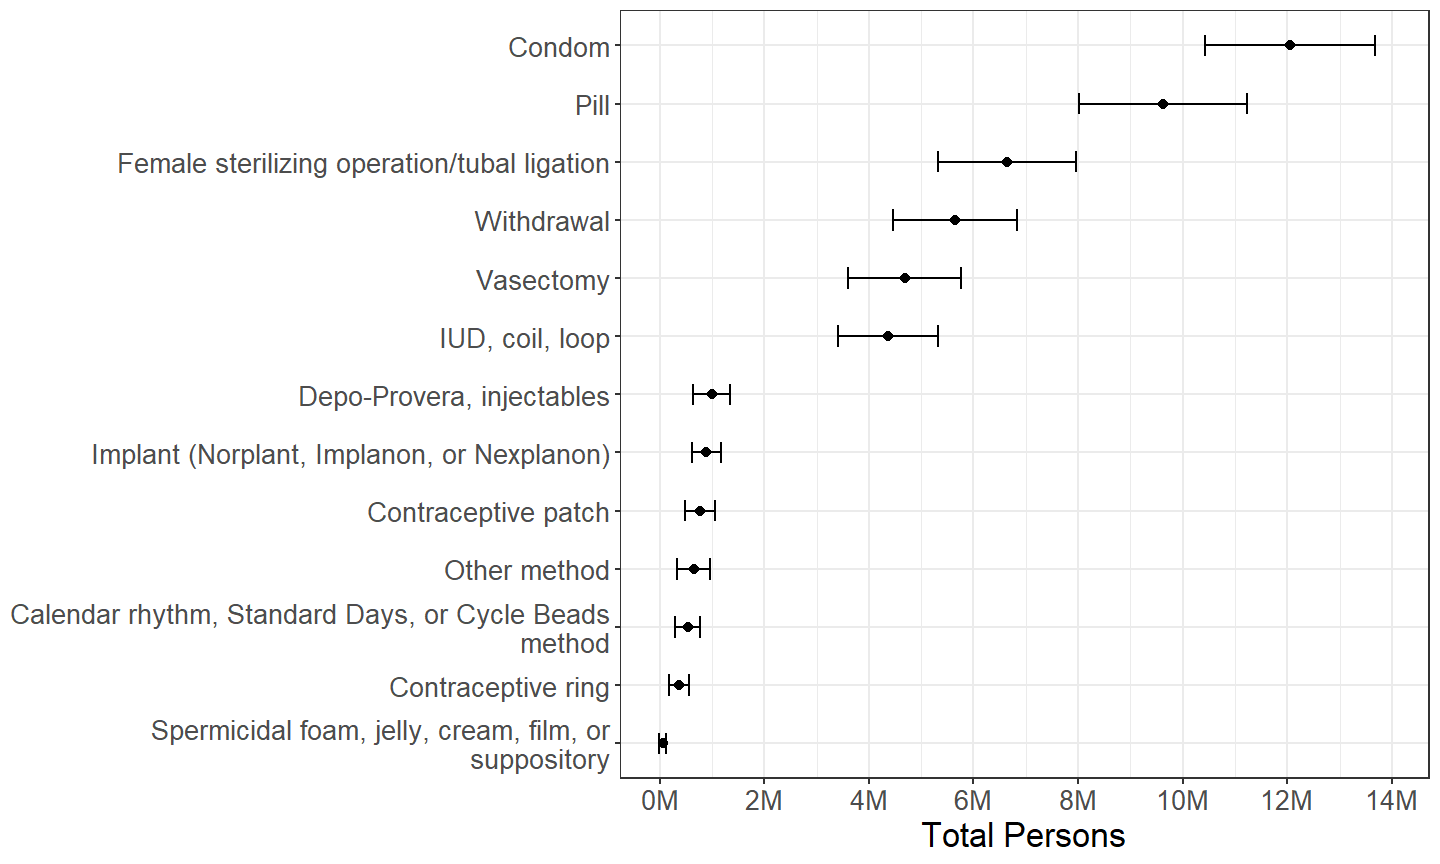
Figure 2.7: Males categorized by whether or not each contraceptive method was used during last intercourse with a female in the past 3 months, with persons using multiple methods counted multiple times.
Overall, there are similar distributions in contraceptive method(s) used during last intercourse reported by females and males. (Figures 2.6 and 2.7) For instance, condoms and pills are the most commonly reported methods by males, and they are the second and third most common methods reported by females. Indeed, female sterilizing operations, condoms, and pills are in the top three most common methods reported both by females and males. However, the most salient difference between females and males is that approximately 10.5M females report a female sterilizing operation being used during their last intercourse, whereas only approximately 6.7M males report a female sterilizing operation being used.
Other differences include a greater number of males reporting use of condom, pill, contraceptive patch, and “other” methods than females, and a greater number of females reporting use of intrauterine device (IUD), calendar-based, and temperature or cervical mucus test methods. Possible reasons for these and other differences are discussed in Section 3.1.
Estimates of the number of female and male persons using withdrawal, vasectomy, implant, injectable, and ring methods are similar between females and males. Methods such as suppository, female condom, diaphragm, film, foam, jelly, and cream are rarely reported used by either females or males. Withdrawal is the fourth most commonly reported method both by females and males.
2.2.7 Method Used Exclusively
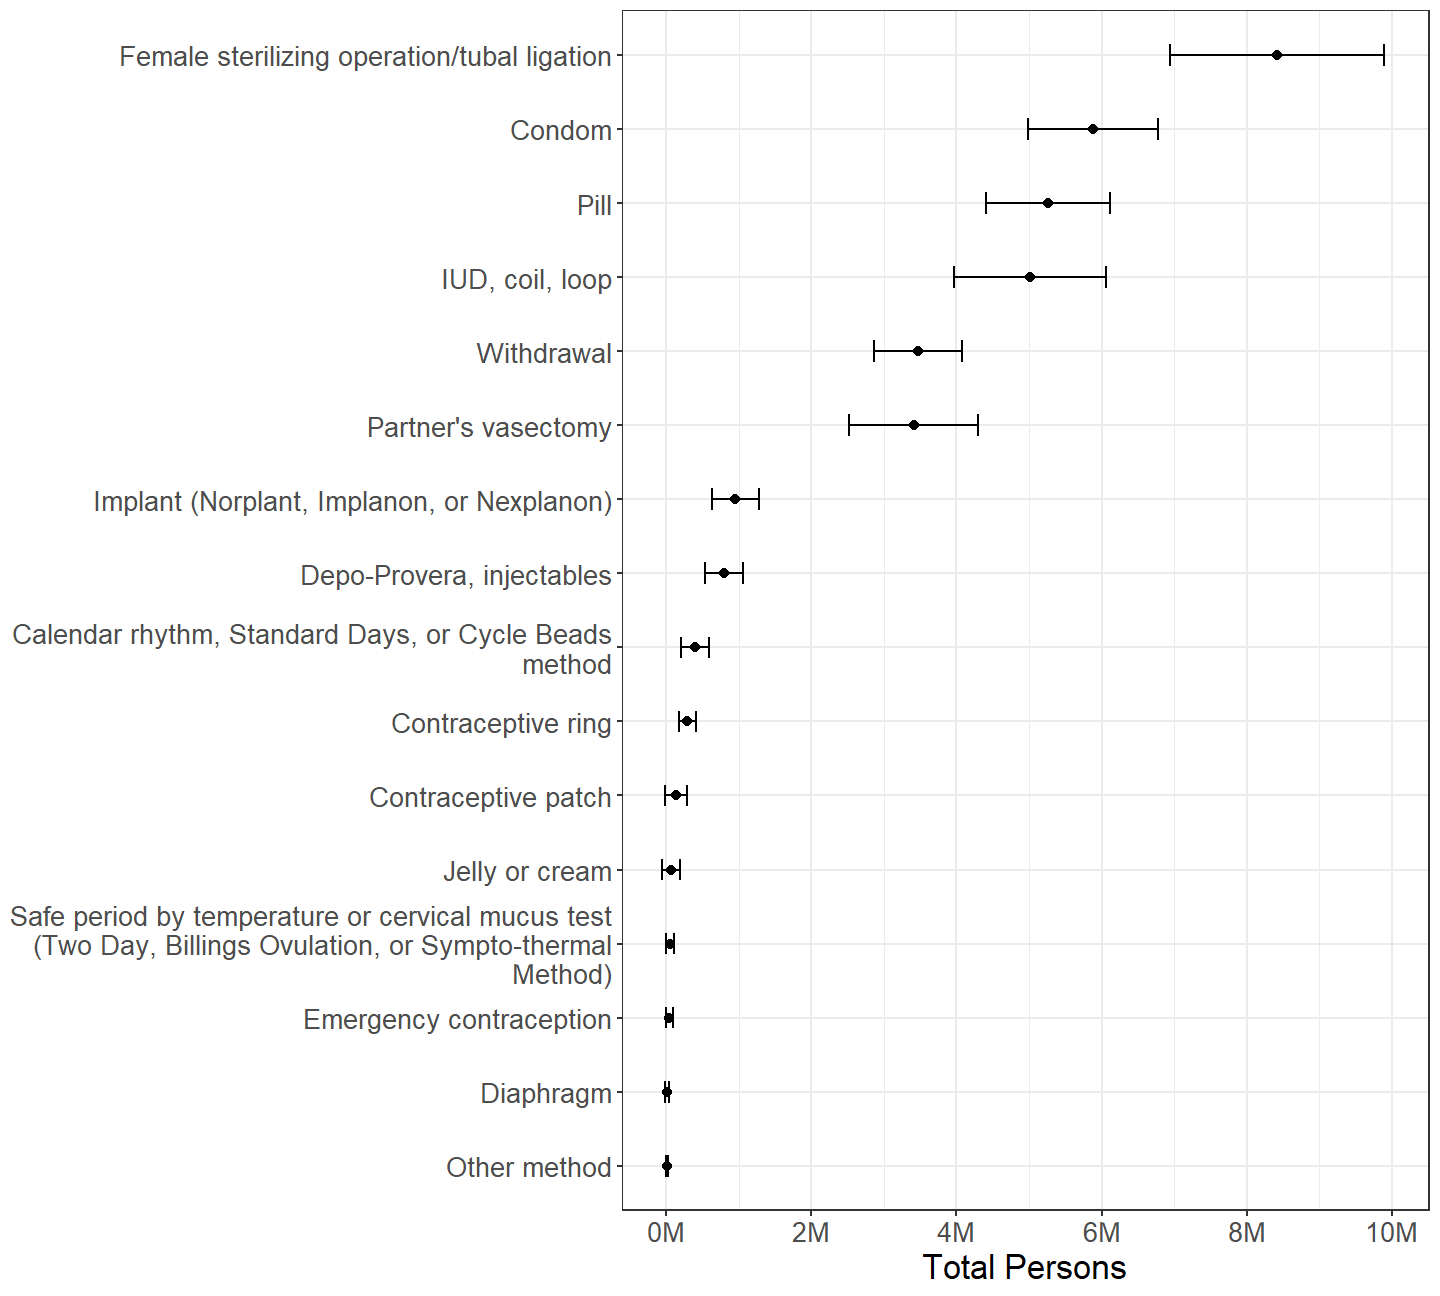
Figure 2.8: Females categorized by which contraceptive method was used during last intercourse with a male in the past 3 months, among those who used exactly one method during last intercourse.
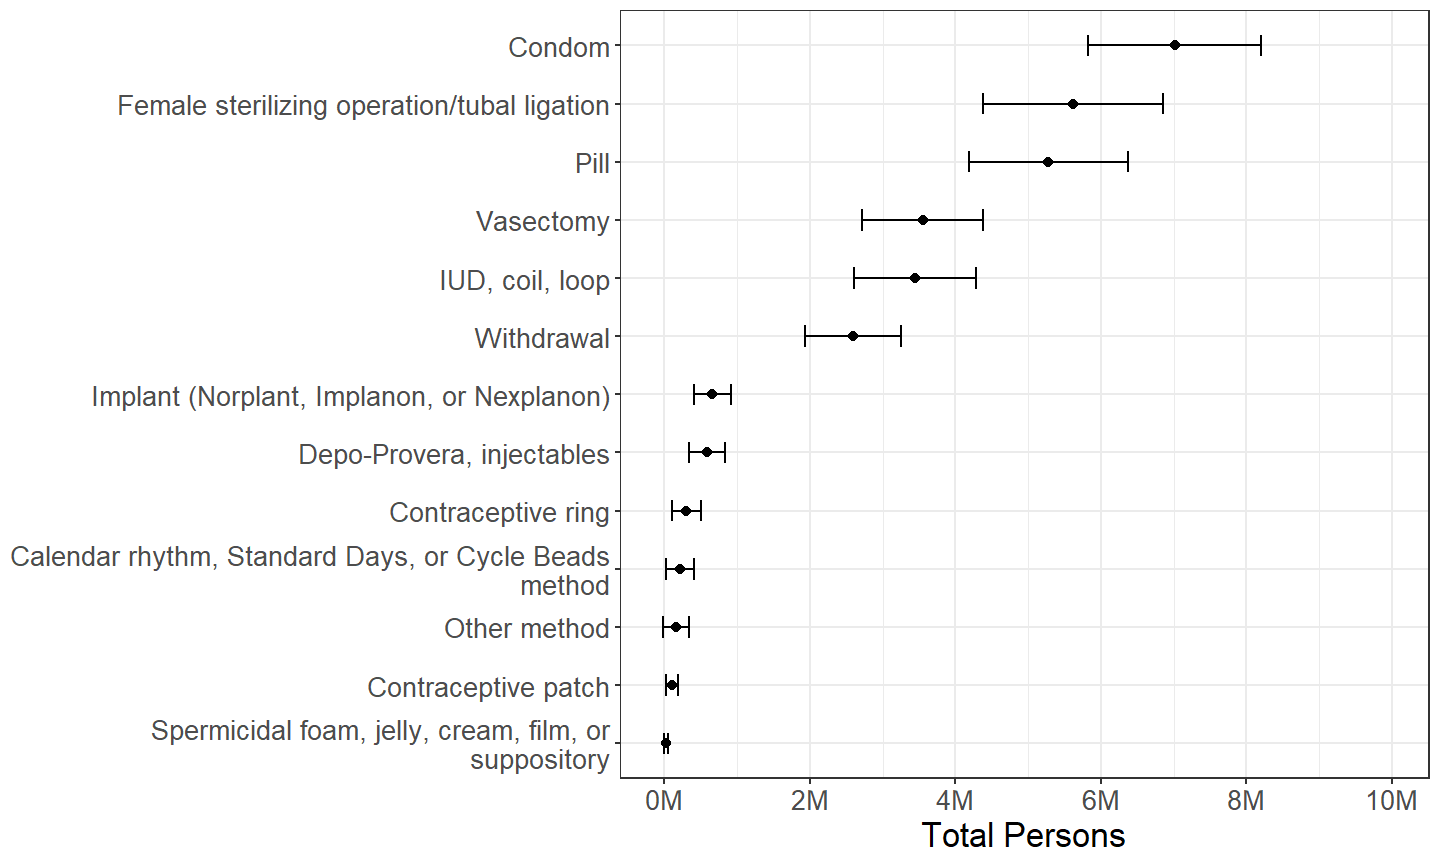
Figure 2.9: Males categorized by which contraceptive method was used during last intercourse with a female in the past 3 months, among those who used exactly one method during last intercourse.
Restricting analysis to persons who used only one method of contraception during their last intercourse, there is a similar overall pattern of contraceptive method use as seen in Section 2.2.6. (Figures 2.8 and 2.9) However, in this subdomain, the number of females and number of males reporting pill use is roughly the same. Another salient difference in this subdomain is that there are relatively fewer persons who report using withdrawal, indicating a substantial number of withdrawal users do not rely on withdrawal as their only method of contraception, which is investigated further in Section 2.2.8.
2.2.8 Proportion of Method Users Who Also Used Other Method(s)
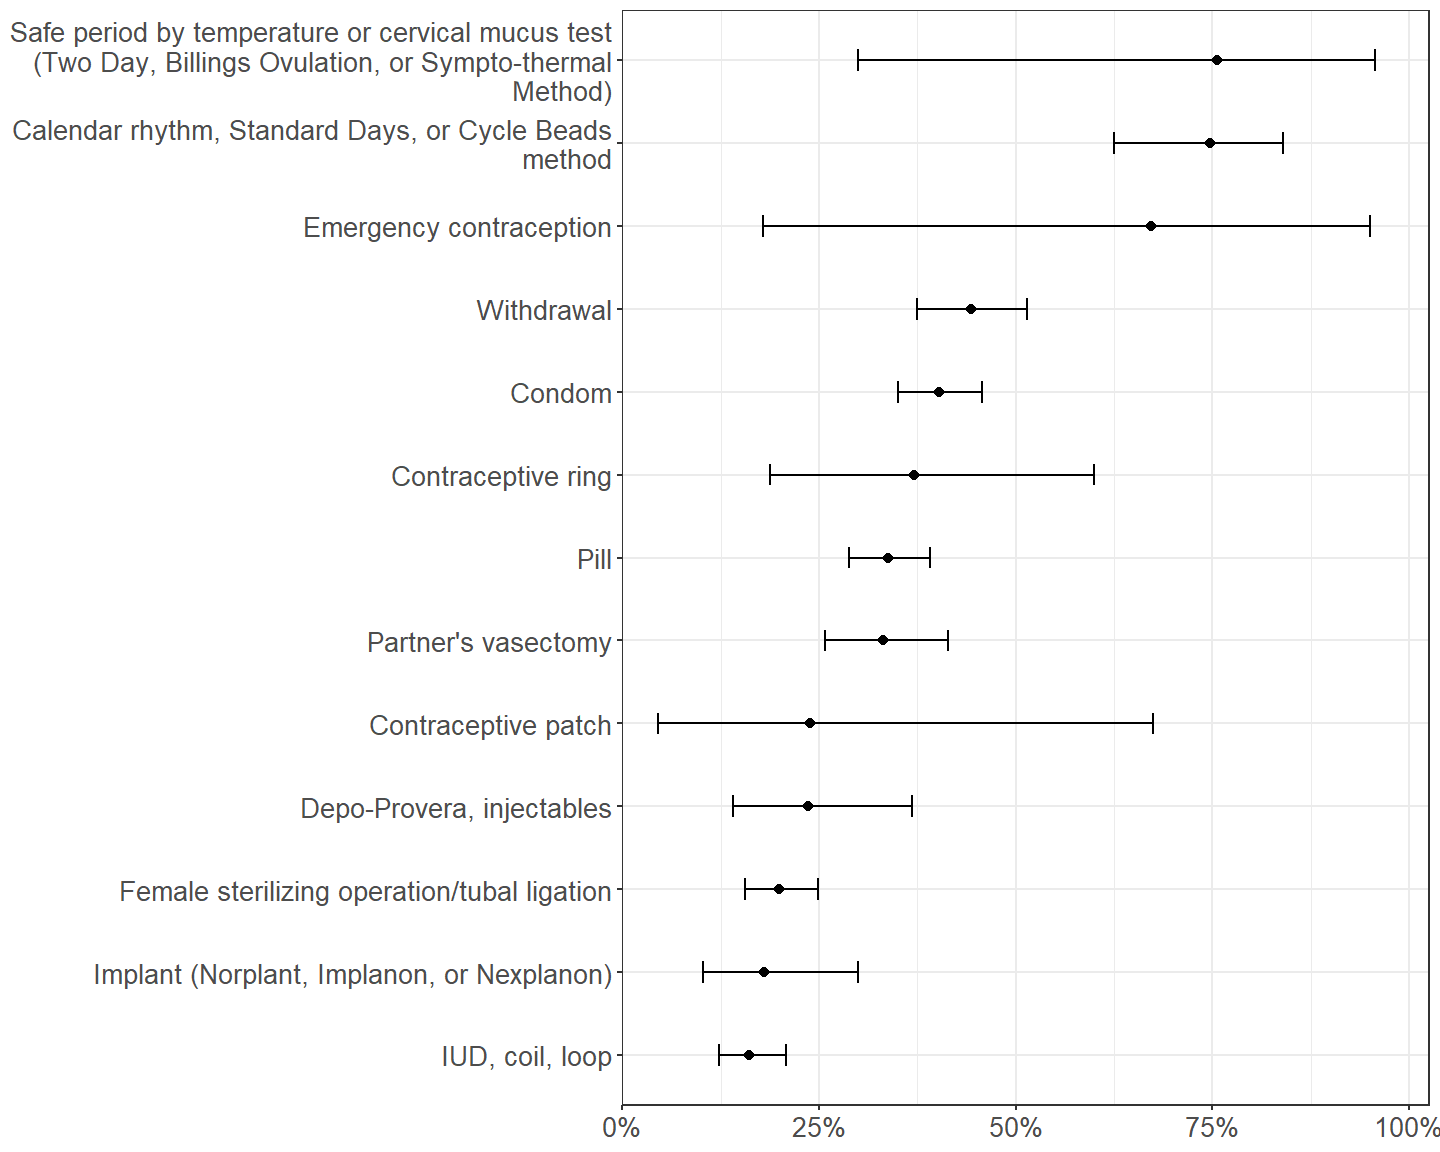
Figure 2.10: Proportion using another method of contraception among females using each method of contraception during last intercourse with a male in the past 3 months.
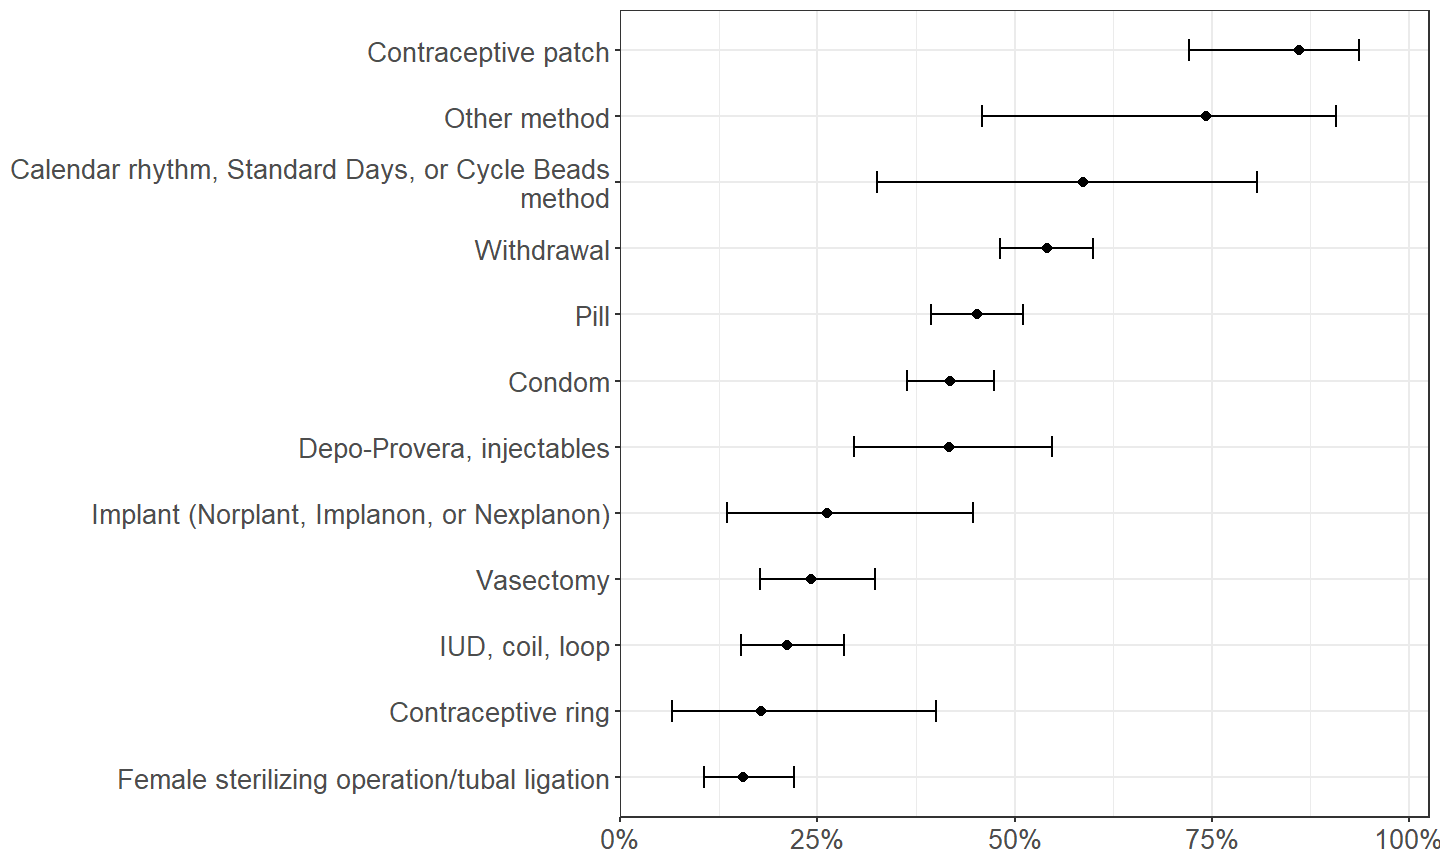
Figure 2.11: Proportion using another method of contraception among males using each method of contraception during last intercourse with a female in the past 3 months.
A direct way to measure the extent to which specific contraceptive methods are used exclusively or in combination with other methods is to estimate the proportion of users of each method that used it with another method. (Figures 2.10 and 2.11.) The number of persons using safe period by temperature or cervical mucus test method, contraceptive patch method, emergency contraception, and “other” method are relatively few, constituting small effective sample sizes with large sampling errors. Indeed, estimates for contraceptive patch are contradictory between female and male respondents.
Ignoring those, calendar-based methods have the greatest proportion of users who also used another method during their last intercourse, particularly among females. As alluded to in Section 2.2.7, about half of withdrawal users used another method during their last intercourse. Thus, withdrawal use is split between those using withdrawal alone as a method of contraception and those using withdrawal in addition to another method.
While a simple majority of users of pill and condom methods used them exclusively during their last intercourse, a sizable minority of pill and condom users also used another method. On the other hand, female sterilizing operation, IUD, and perhaps contraceptive ring are the methods most often used exclusively.
The remaining subsections of Section 2.2 explore what other contraceptive methods are used in conjunction with the methods commonly used with others, i.e., calendar, withdrawal, condom, and pill methods.
2.2.9 Other Method(s) Used with Calendar Method
| Total | Percentage | ||||
|---|---|---|---|---|---|
| Est. | 95% C.I. | Est. | 95% C.I. | ||
| Females | Withdrawal | 0.77M | (0.47M, 1.07M) | 49.0% | (36.8%, 61.4%) |
| Condom | 0.51M | (0.25M, 0.76M) | 32.2% | (20.4%, 46.8%) | |
| Safe period by temperature or cervical mucus test (Two Day, Billings Ovulation, or Sympto-thermal Method) | 0.06M | (0.00M, 0.11M) | 3.6% | (1.4%, 9.1%) | |
| Pill | 0.01M | (-0.01M, 0.04M) | 0.9% | (0.1%, 6.2%) | |
| Males | Withdrawal | 0.26M | (0.12M, 0.41M) | 49.2% | (26.5%, 72.3%) |
| Condom | 0.07M | (-0.01M, 0.14M) | 12.2% | (3.7%, 33.5%) | |
| Pill | 0.05M | (-0.02M, 0.12M) | 9.6% | (2.3%, 32.0%) | |
When used in conjunction with other methods, calendar-based methods are most commonly used with withdrawal or to a lesser extent condoms. (Table 2.11)
2.2.10 Other Method(s) Used with Withdrawal, Condom, and Pill
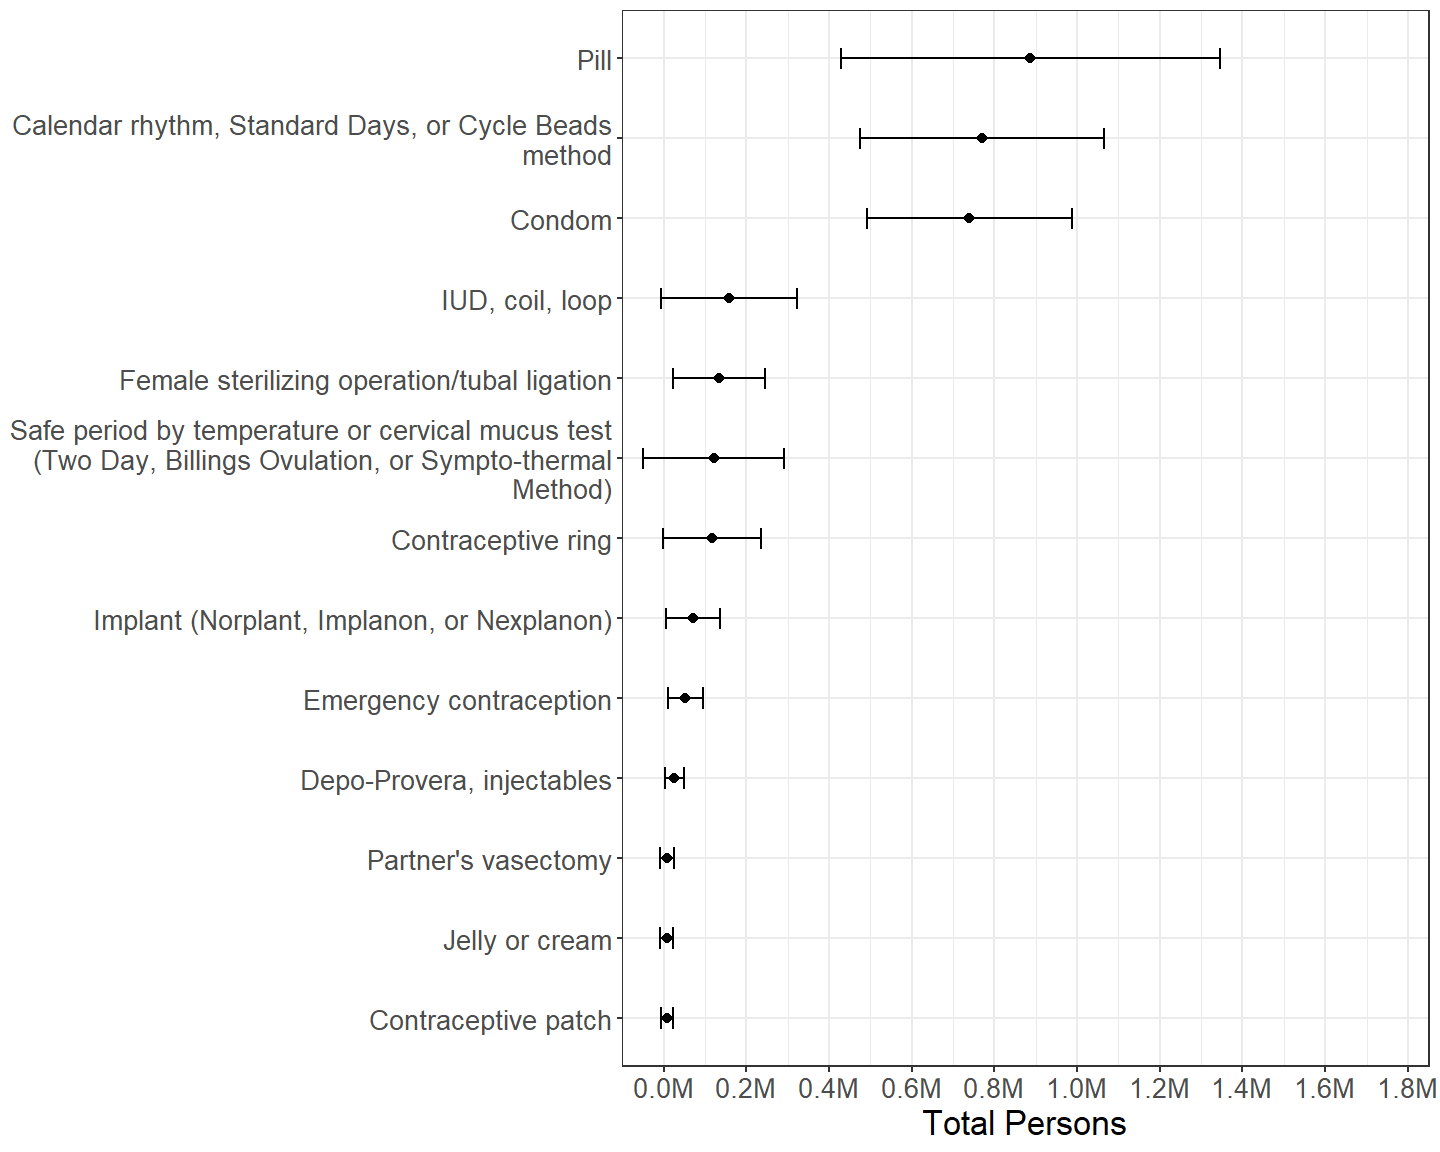
Figure 2.12: Females by other contraceptive method(s) used during last intercourse, among those who used withdrawal during last intercourse with a male in the past 3 months.
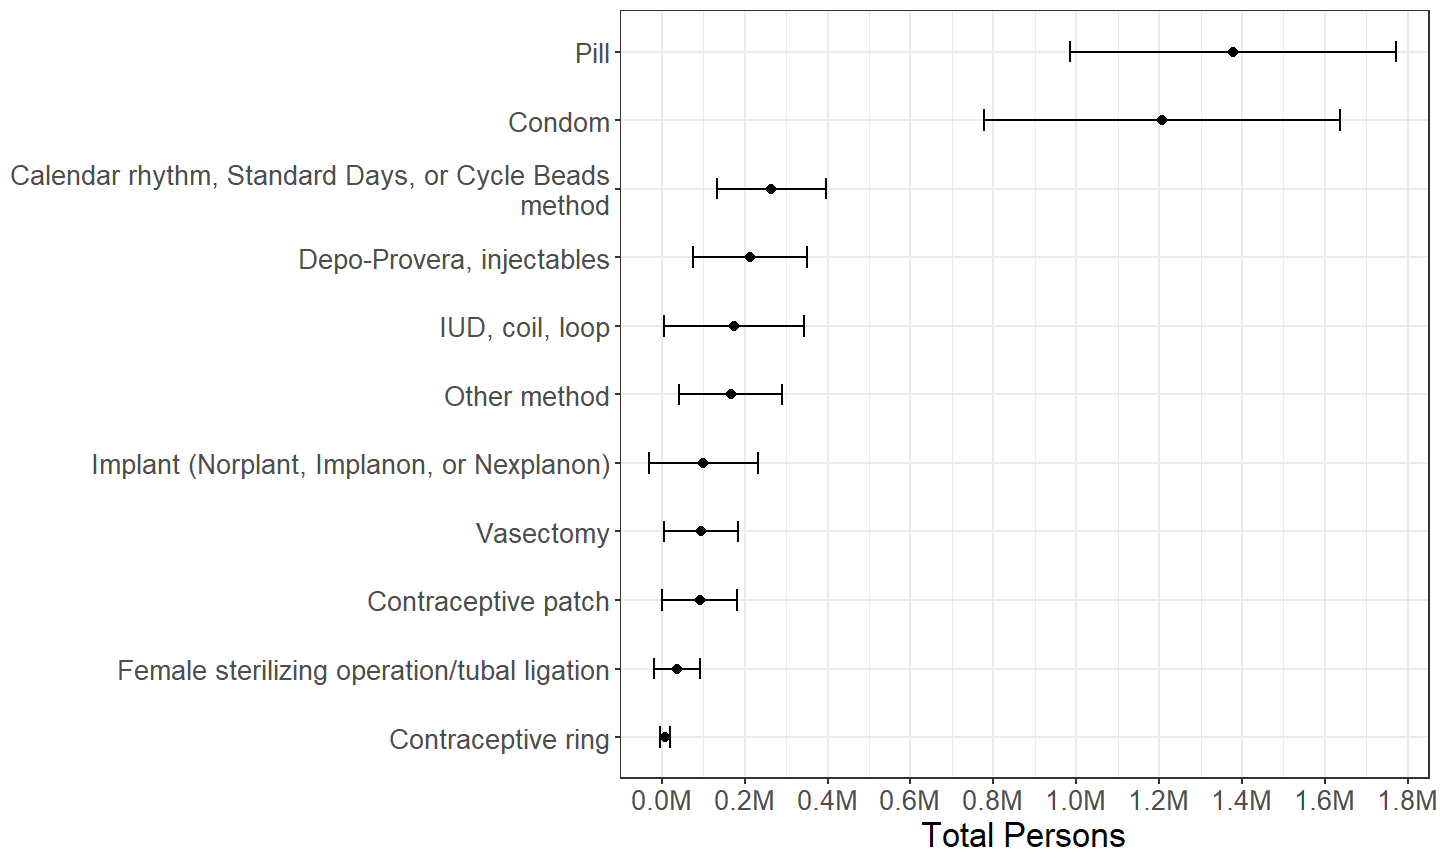
Figure 2.13: Males by other contraceptive method(s) used during last intercourse, among those who used withdrawal during last intercourse with a female in the past 3 months.
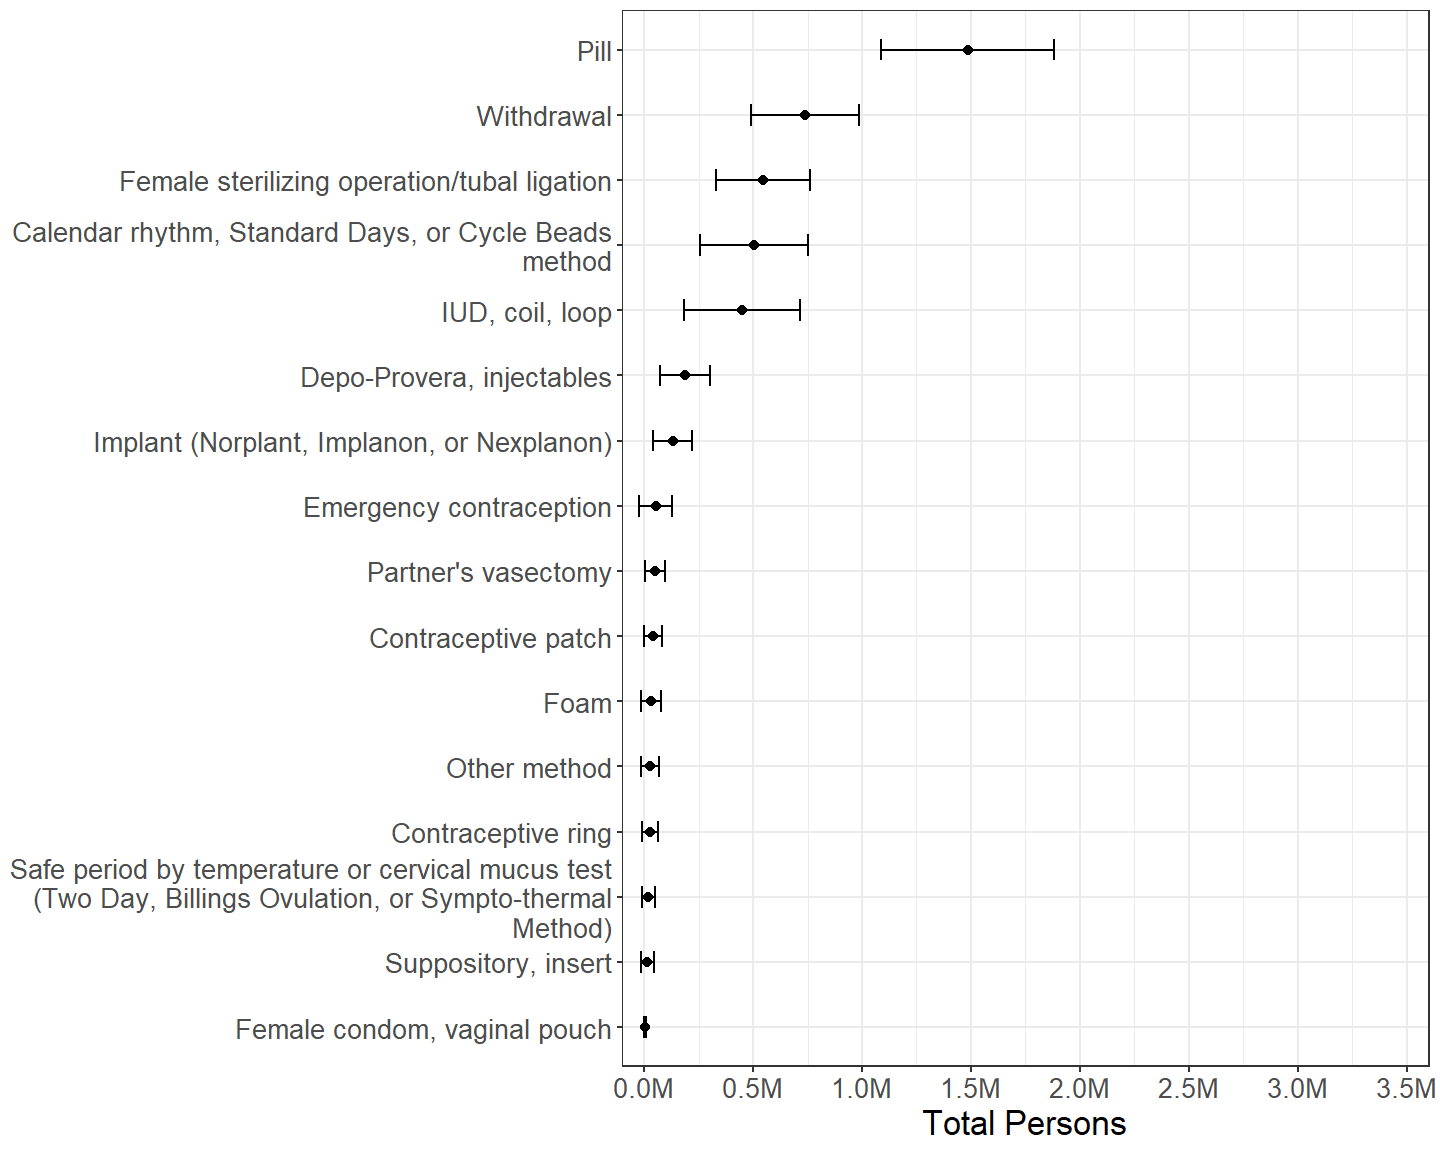
Figure 2.14: Females by other contraceptive method(s) used during last intercourse, among those who used condom during last intercourse with a male in the past 3 months.
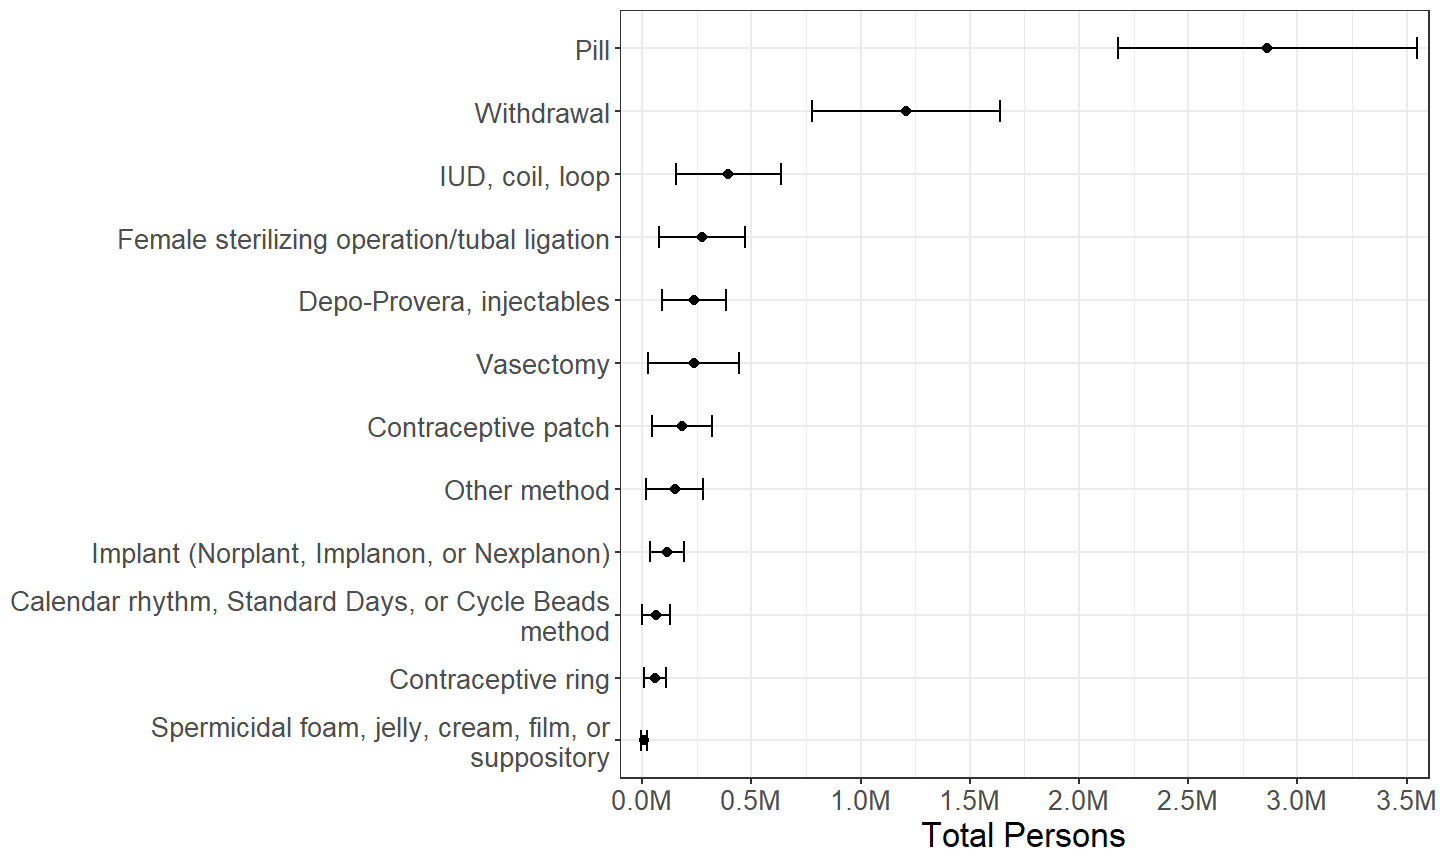
Figure 2.15: Males by other contraceptive method(s) used during last intercourse, among those who used condom during last intercourse with a female in the past 3 months.
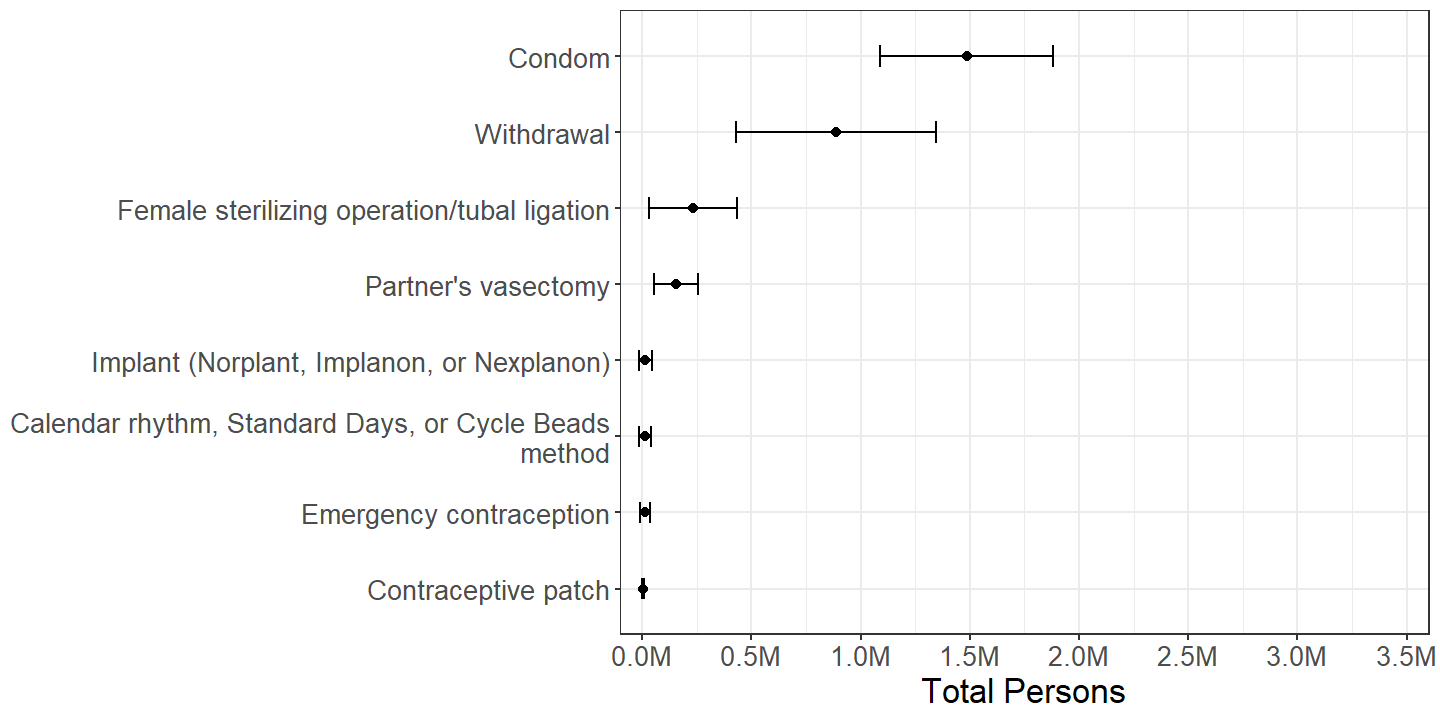
Figure 2.16: Females by other contraceptive method(s) used during last intercourse, among those who used pill during last intercourse with a male in the past 3 months.
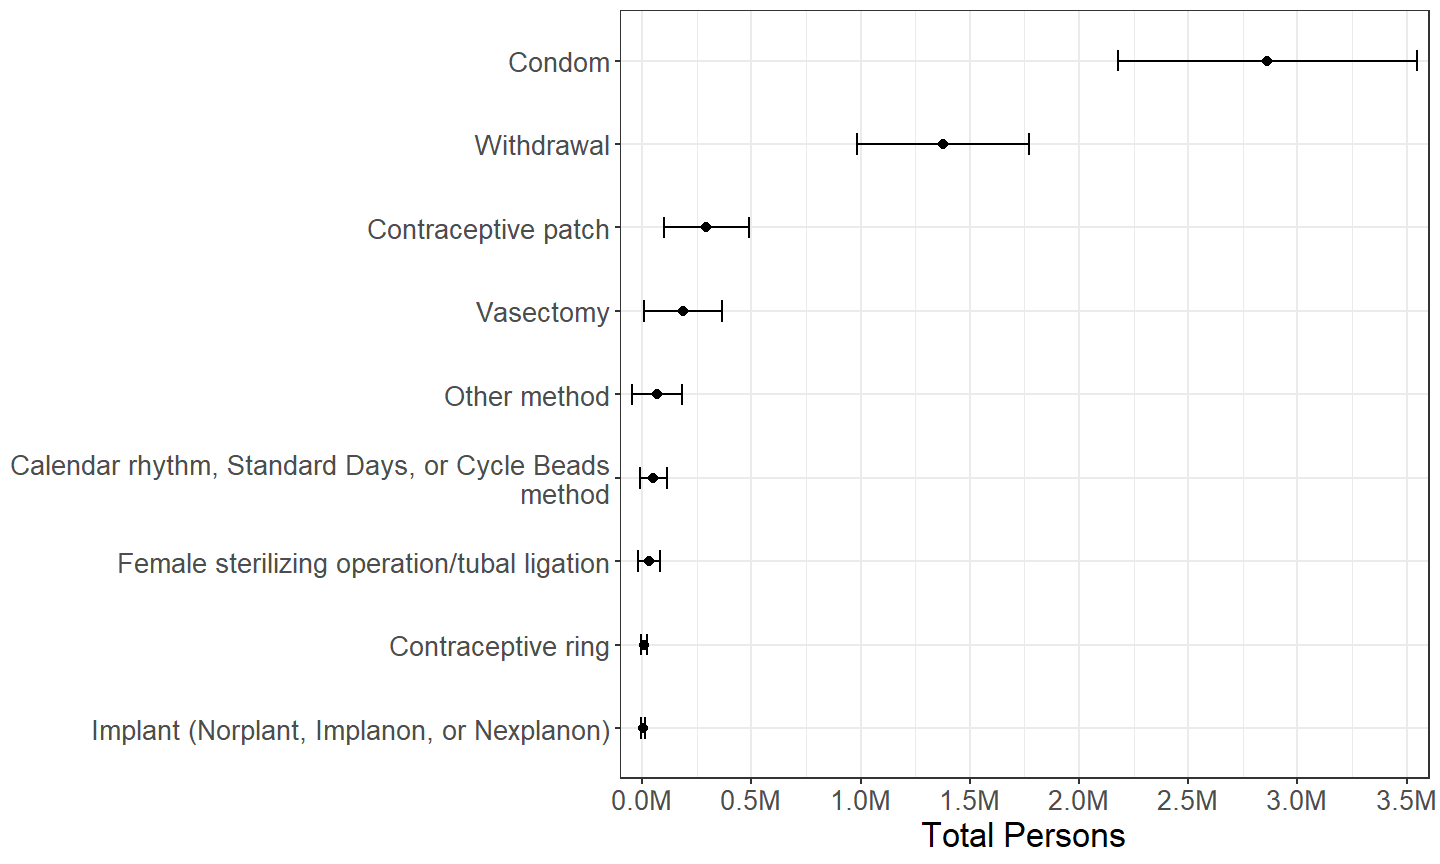
Figure 2.17: Males by other contraceptive method(s) used during last intercourse, among those who used pill during last intercourse with a female in the past 3 months.
When used in conjunction with other methods, withdrawal, condom, and pill methods are used with a variety of other methods, though the most commonly used other methods with any one of these three are the other two methods. (Figures 2.12, 2.13, 2.14, 2.15, 2.16 and 2.17) However, this is to be expected, since these three methods are more common generally. (Section 2.2.6) One exception to this general trend is that calendar-based methods are unusually common among methods used in conjunction with withdrawal as reported by females. (Figure 2.12)
2.3 Use of Contraception during Past 12 Months
Section 2.2.1 identified approximately 3.69M females and 5.82M males at increased risk for unintended pregnancy due to not using contraception during their last intercourse. In order to investigate whether this is due to habitual nonuse of contraception or due to inconsistency of use, this section examines use of contraception over the preceding 12 months.
| Total | Percentage | ||||
|---|---|---|---|---|---|
| Est. | 95% C.I. | Est. | 95% C.I. | ||
| Females | Did not have intercourse | 15.8M | (14.1M, 17.6M) | 21.8% | (20.2%, 23.3%) |
| Had intercourse | 56.8M | (51.0M, 62.7M) | 78.2% | (76.7%, 79.8%) | |
| Males | Did not have intercourse | 16.2M | (13.7M, 18.6M) | 22.4% | (20.4%, 24.3%) |
| Had intercourse | 56.1M | (50.1M, 62.0M) | 77.6% | (75.7%, 79.6%) | |
The size of the relevant subdomain for this section is approximately 56.8M females and 56.1M males. (Table 2.12)
2.3.1 Number of Methods
| Total | Percentage | ||||
|---|---|---|---|---|---|
| Est. | 95% C.I. | Est. | 95% C.I. | ||
| Females | 0 | 6.24M | (5.35M, 7.13M) | 11.0% | (9.6%, 12.4%) |
| 1 | 32.77M | (29.35M, 36.18M) | 57.7% | (55.3%, 60.0%) | |
| 2 | 13.54M | (11.41M, 15.67M) | 23.8% | (21.6%, 26.1%) | |
| 3 | 3.38M | (2.65M, 4.12M) | 6.0% | (4.9%, 7.0%) | |
| 4 | 0.78M | (0.49M, 1.07M) | 1.4% | (0.9%, 1.9%) | |
| 5 | 0.13M | (0.04M, 0.21M) | 0.2% | (0.1%, 0.4%) | |
| Males | 0 | 8.26M | (6.74M, 9.78M) | 14.7% | (12.5%, 17.0%) |
| 1 | 27.70M | (24.66M, 30.75M) | 49.4% | (46.7%, 52.1%) | |
| 2 | 13.26M | (11.21M, 15.31M) | 23.7% | (21.4%, 25.9%) | |
| 3 | 5.82M | (4.75M, 6.89M) | 10.4% | (8.9%, 11.8%) | |
| 4 | 0.96M | (0.63M, 1.28M) | 1.7% | (1.2%, 2.3%) | |
| 5 | 0.06M | (0.01M, 0.11M) | 0.1% | (0.0%, 0.2%) | |
A majority of persons sexually active in the past 12 months used at least one method of contraception at least once in the past 12 months, and a sizable minority used more than one method of contraception in the past 12 months. (Table 2.13)
The estimates of those who have not used any method of contraception in the past 12 months despite being sexually active in Table 2.13 should not be interpreted as an estimate of those at increased risk for unintended pregnancy due to not using contraception, since the estimates include sexual partners trying to conceive, partners with a pregnant or postpartum female, and partners with one or more physically infertile persons.6
2.3.2 Method(s) Used
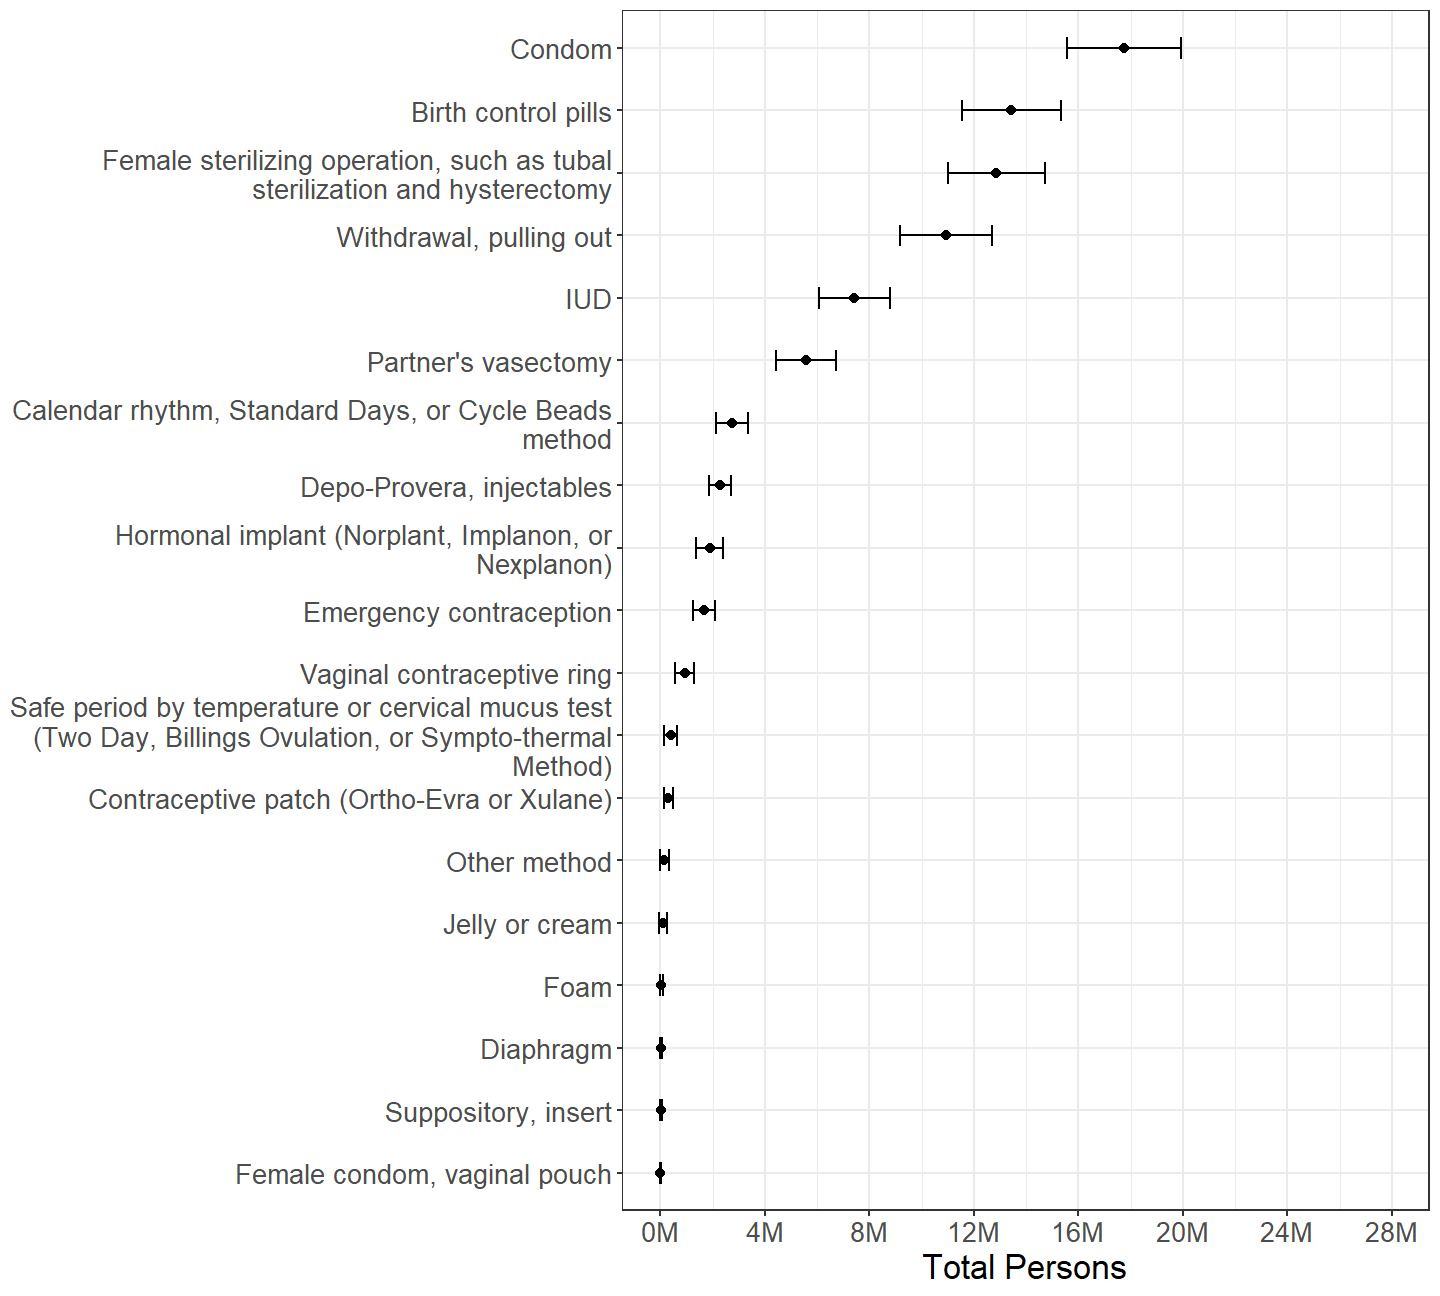
Figure 2.18: Females categorized by whether or not each contraceptive method was used at all during the past 12 months, with persons using multiple methods counted multiple times.
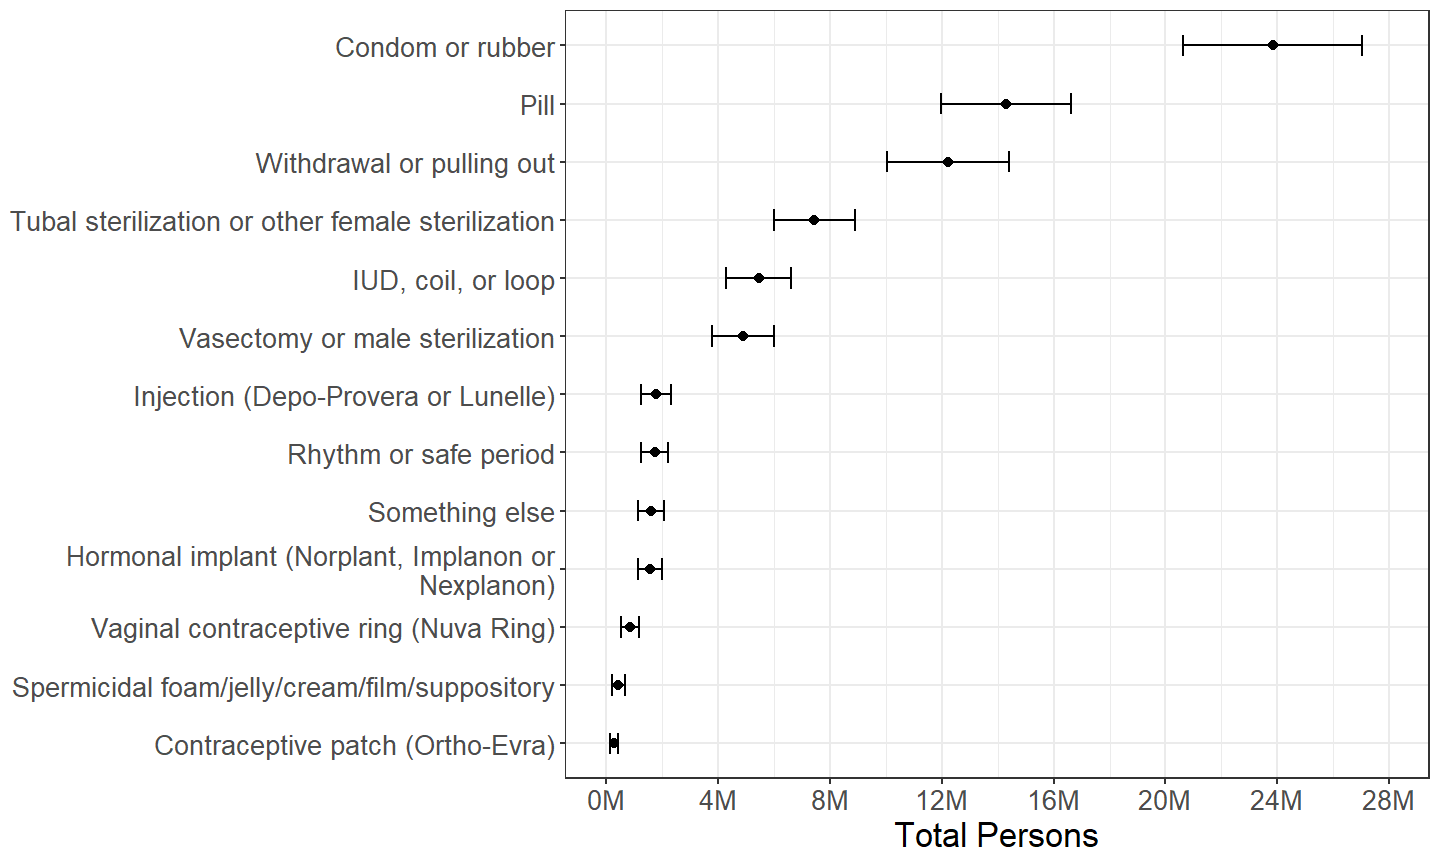
Figure 2.19: Males categorized by whether or not each contraceptive method was used at all during the past 12 months, with persons using multiple methods counted multiple times.
The distribution of method(s) used by females in the past 12 months in Table 2.18 parallels the distribution of method(s) used during last intercourse in Figure 2.6, with the counts of persons using each method increased. The major exception is the number of females using a sterilizing operation, which is barely greater in Figure 2.18, causing it to be the third most rather than most prevalent method of contraception among females when examining the past 12 months.
Similarly, the distribution of method(s) used in the past 12 months in Table 2.19 parallels the distribution of method(s) used during last intercourse in Figure 2.7, but with counts of those using female sterilizing operations not increasing as much as other methods, causing it to decrease from the third most to the fourth most prevalent method among males when examining the past 12 months. A salient feature of Figure 2.19 is the extent to which the number of males who have used condoms at least once in the past 12 months is greater than other methods.
2.3.3 Method Used Exclusively
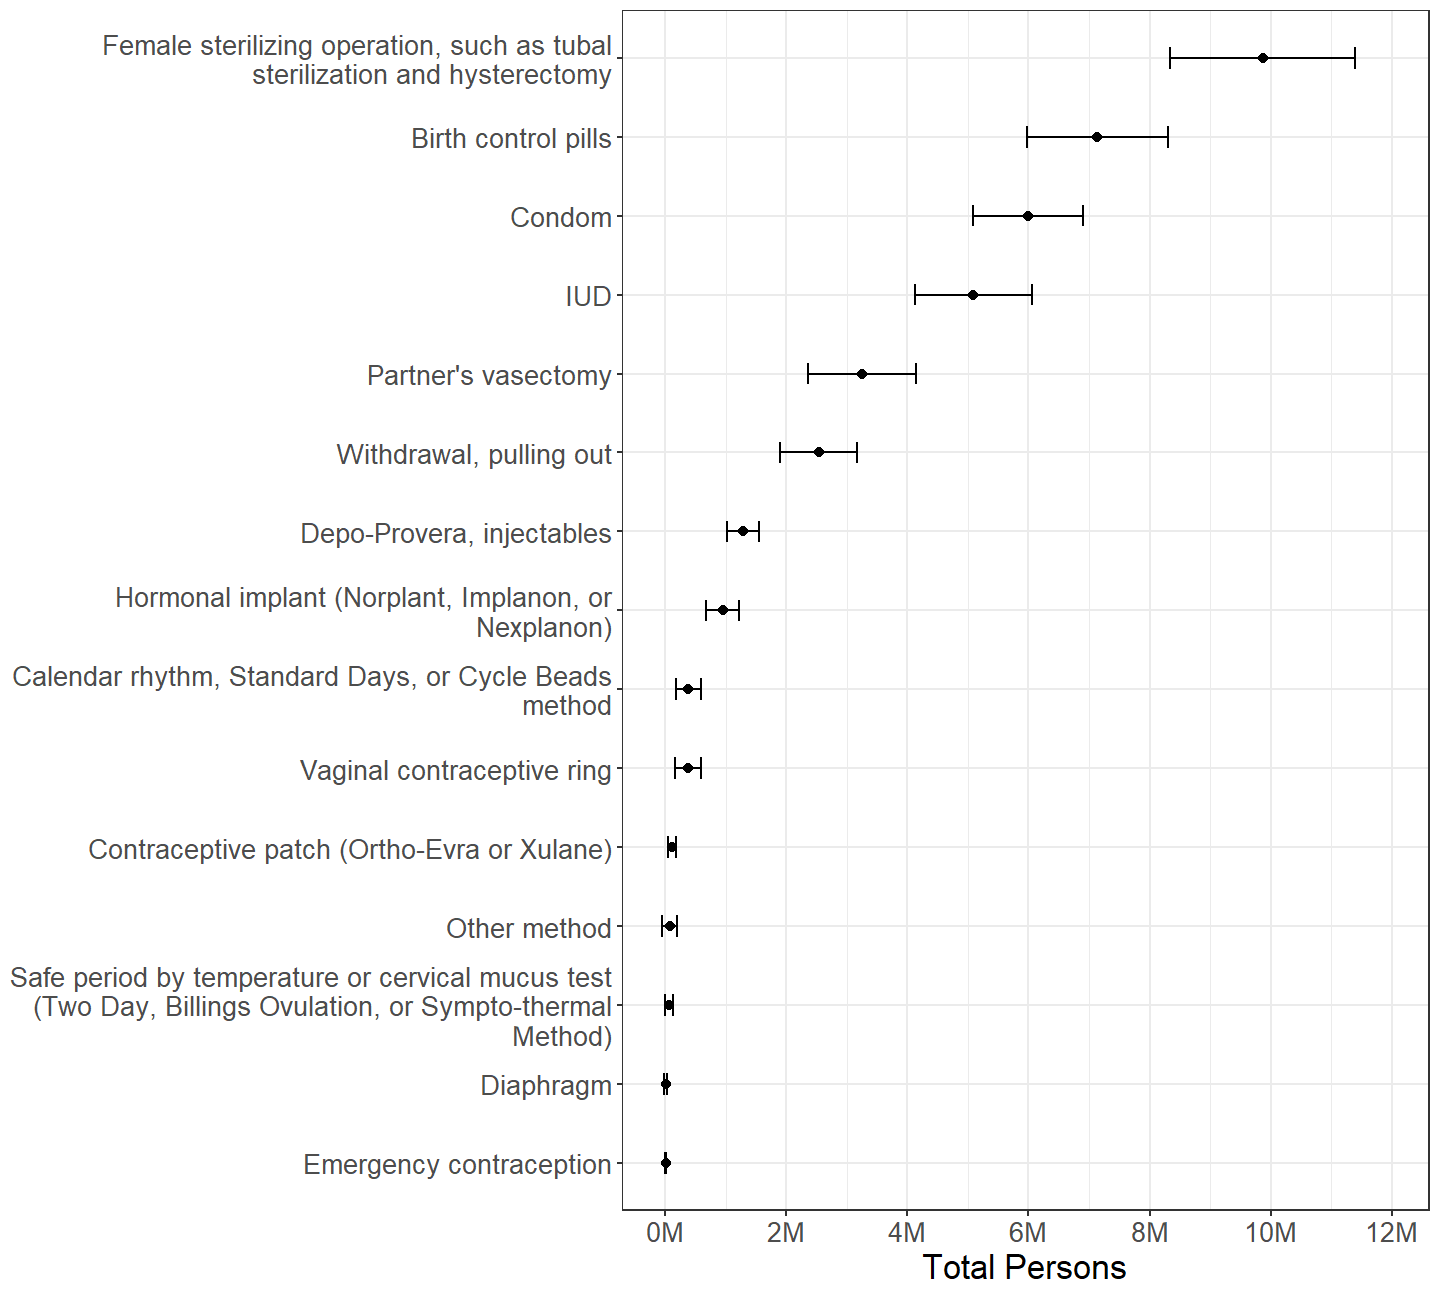
Figure 2.20: Females categorized by which contraceptive method was used during past 12 months, among those who used exactly one method in past 12 months.
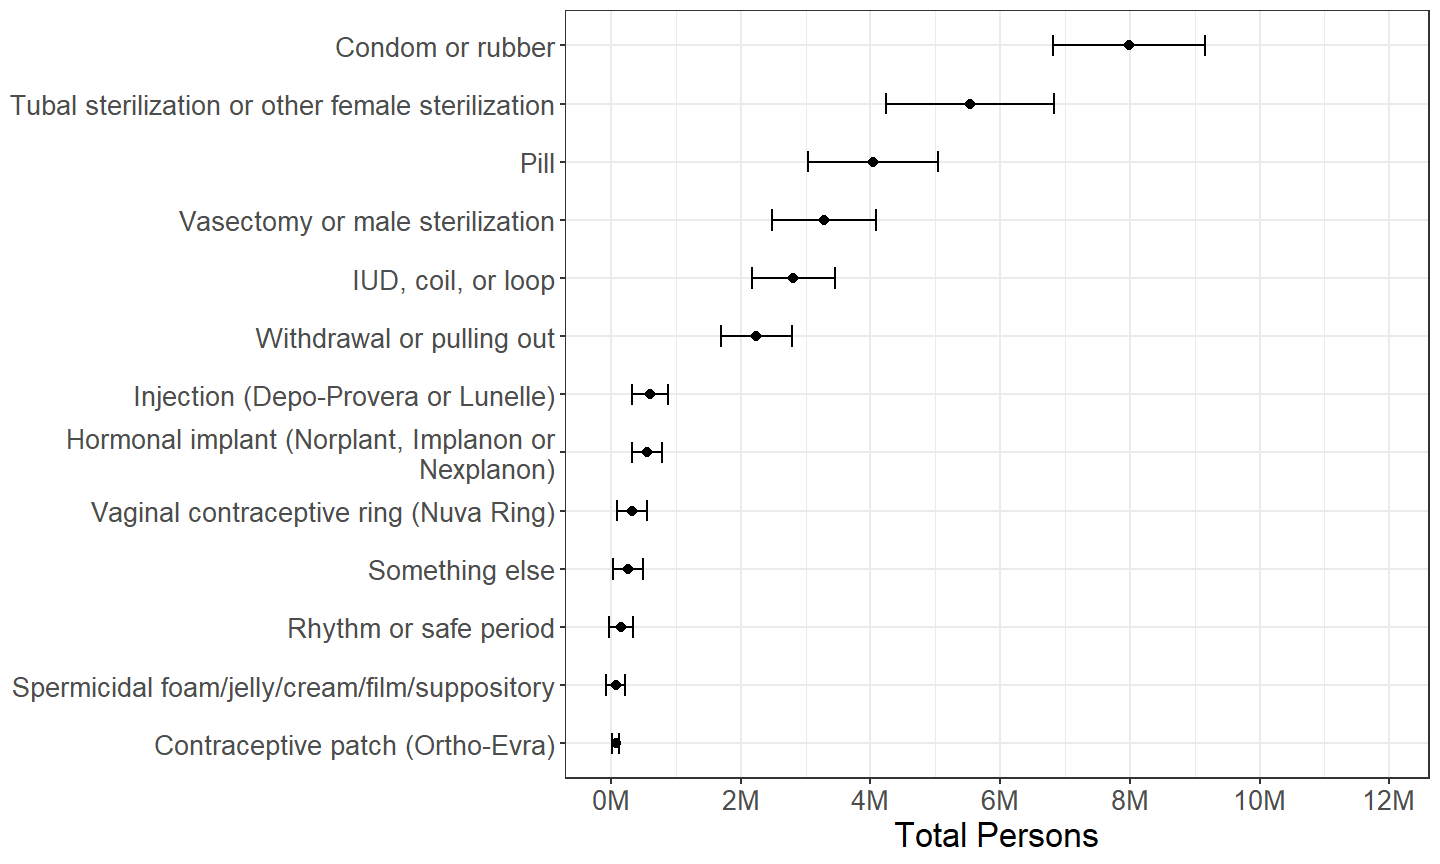
Figure 2.21: Males categorized by which contraceptive method was used during past 12 months, among those who used exactly one method in past 12 months.
When restricting analysis to those who reported using only one method of contraception, the distributions of method used during the past 12 months (Figures 2.20 and 2.21) parallels the distributions of method used during last intercourse (Figures 2.8 and 2.9) very closely, with female sterilizing operation being the most commonly method reported by females, and condoms then female sterilizing operation being the most commonly methods reported by males.
2.4 Consistency of Use of Contraception
| Total | Percentage | ||||
|---|---|---|---|---|---|
| Est. | 95% C.I. | Est. | 95% C.I. | ||
| Females | Did not use contraception in past 12 months | 2.11M | (1.57M, 2.64M) | 57.1% | (47.7%, 66.5%) |
| Used contraception in past 12 months | 1.58M | (1.03M, 2.13M) | 42.9% | (33.5%, 52.3%) | |
| Males | Did not use contraception in past 12 months | 3.27M | (2.44M, 4.10M) | 56.2% | (47.1%, 65.3%) |
| Used contraception in past 12 months | 2.55M | (1.84M, 3.26M) | 43.8% | (34.7%, 52.9%) | |
| Total | Percentage | |||
|---|---|---|---|---|
| Est. | 95% C.I. | Est. | 95% C.I. | |
| Did not use contraception in month of last intercourse | 2.71M | (2.07M, 3.34M) | 73.4% | (64.1%, 82.7%) |
| Used contraception in month of last intercourse | 0.98M | (0.53M, 1.43M) | 26.6% | (17.3%, 35.9%) |
| Total | Percentage | |||
|---|---|---|---|---|
| Est. | 95% C.I. | Est. | 95% C.I. | |
| Has not use contraception ever in lifetime | 0.28M | (0.09M, 0.46M) | 7.5% | (3.1%, 12.0%) |
| Used contraception ever in lifetime | 3.41M | (2.63M, 4.19M) | 92.5% | (88.0%, 96.9%) |
Some of those who did not use contraception during their most recent intercourse with the opposite sex in the past 3 months despite being at risk for unintended pregnancy might use contraception generally, having failed to do so during their most recent intercourse because of inconsistency. Respondents to the NSFG were not directly asked whether this was the case, but this can be inferred in other ways.
The subdomain of those at increased risk of unintended pregnancy due to contraceptive nonuse constitutes a relatively small sample, as seen in the relatively great sampling error in Table 2.14. Nonetheless, slightly less than half of those who did not use contraception at their most recent intercourse despite being at risk for unintended pregnancy used contraception at least once the past 12 months. This implies that those at increased risk for unintended pregnancy due to lack of contraception use are split between those who are using contraception inconsistently and those who are not using contraception at all.
A substantial minority of females who did not use contraception during their most recent intercourse despite being at risk of unintended pregnancy reported using at least one method of contraception during the month of their most recent intercourse, providing further evidence that some of this contraceptive nonuse is due to inconsistency. (Table 2.15)
Nearly all females who did not use contraception during their most recent intercourse despite being at risk of unintended pregnancy have used contraception at some point in their lifetime, indicating that contraceptive nonuse in these cases is rarely if ever a matter of principle. (Table 2.16)
Male respondents to the NSFG are not asked if they have ever used the various contraceptive methods, nor do they fill out the contraceptive use calendar that female respondents do, so estimates for males such as those in Tables 2.15 and 2.16 are not available.
2.4.1 Any Method During Past 12 Months
| Total | Percentage | ||||
|---|---|---|---|---|---|
| Est. | 95% C.I. | Est. | 95% C.I. | ||
| Females | Every time | 30.12M | (26.49M, 33.74M) | 73.7% | (71.5%, 75.8%) |
| Most of the time | 4.21M | (3.50M, 4.91M) | 10.3% | (8.9%, 11.7%) | |
| About half of the time | 1.32M | (0.98M, 1.66M) | 3.2% | (2.3%, 4.2%) | |
| Some of the time | 2.18M | (1.68M, 2.68M) | 5.3% | (4.3%, 6.3%) | |
| None of the time | 2.92M | (2.21M, 3.64M) | 7.2% | (5.6%, 8.7%) | |
| Refused | 0.05M | (-0.03M, 0.13M) | 0.1% | (-0.1%, 0.3%) | |
| Don't know | 0.00M | (-0.00M, 0.01M) | 0.0% | (-0.0%, 0.0%) | |
| No answer provided | 0.09M | (0.02M, 0.15M) | 0.2% | (0.0%, 0.4%) | |
| Males | Every time | 25.51M | (22.24M, 28.78M) | 72.4% | (69.8%, 75.0%) |
| Most of the time | 4.73M | (3.63M, 5.83M) | 13.4% | (11.1%, 15.7%) | |
| About half of the time | 1.41M | (1.03M, 1.78M) | 4.0% | (3.0%, 5.0%) | |
| Some of the time | 2.40M | (1.78M, 3.01M) | 6.8% | (5.1%, 8.5%) | |
| None of the time | 1.16M | (0.79M, 1.54M) | 3.3% | (2.2%, 4.4%) | |
| Refused | 0.02M | (-0.01M, 0.05M) | 0.1% | (-0.0%, 0.1%) | |
| Don't know | 0.02M | (-0.01M, 0.04M) | 0.0% | (-0.0%, 0.1%) | |
Among those who have used a method of contraception in the past 12 months, the majority of persons report using a method of contraception every time, though a substantial minority report more inconsistency in their contraceptive use. Some respondents to the NSFG report their frequency of using any method of contraception to be “none of the time.” This is contradictory with their answers to other questions that indicate that they used at least one method of contraception in the past 12 months. These self-contradictory answers represent several million persons in the population. (Table 2.17)
In the NSFG, different series of questions about consistency of contraceptive use are asked of males who are married or cohabitating than of those who are not, whereas the same series of questions pertaining to consistency are asked of all females. This is why the subdomains for the estimates in Table 2.17 differ slightly for females and for males. The estimates for females exclude all persons who have active sterilizing operations. The estimates for males exclude such persons and also exclude persons who are married or cohabitating with a female partner who has an active sterilizing operation.
In cases of males who have answers for both series of questions because they have had intercourse both with a wife or cohabitating partner and with a more recent female partner in the past 12 months, the answers pertaining to contraceptive use with the more recent partner are used for the estimates of Table 2.17.
Two methods of contraception, condoms and pills, are both popular and require user interventions either during each intercourse or daily, respectively. They are explored further in Sections 2.4.2 and 2.4.3.
2.4.2 Condom Use During Past 12 Months
| Total | Percentage | ||||
|---|---|---|---|---|---|
| Est. | 95% C.I. | Est. | 95% C.I. | ||
| Females | Every time | 3.82M | (3.14M, 4.50M) | 63.9% | (57.7%, 70.0%) |
| Most of the time | 1.03M | (0.69M, 1.37M) | 17.2% | (12.0%, 22.5%) | |
| About half of the time | 0.29M | (0.11M, 0.47M) | 4.8% | (1.8%, 7.8%) | |
| Some of the time | 0.49M | (0.30M, 0.67M) | 8.1% | (5.2%, 11.1%) | |
| None of the time | 0.29M | (0.07M, 0.51M) | 4.8% | (1.4%, 8.2%) | |
| Refused | 0.05M | (-0.03M, 0.13M) | 0.8% | (-0.6%, 2.2%) | |
| No answer provided | 0.02M | (-0.00M, 0.04M) | 0.3% | (-0.1%, 0.6%) | |
| Males | Every time | 4.44M | (3.65M, 5.23M) | 56.2% | (50.2%, 62.1%) |
| Most of the time | 1.77M | (1.23M, 2.31M) | 22.4% | (16.7%, 28.1%) | |
| About half of the time | 0.35M | (0.16M, 0.53M) | 4.4% | (2.1%, 6.6%) | |
| Some of the time | 0.97M | (0.64M, 1.30M) | 12.2% | (8.1%, 16.3%) | |
| None of the time | 0.36M | (0.10M, 0.62M) | 4.5% | (1.4%, 7.6%) | |
| Refused | 0.01M | (-0.01M, 0.04M) | 0.2% | (-0.1%, 0.4%) | |
| No answer provided | 0.01M | (-0.01M, 0.03M) | 0.1% | (-0.1%, 0.4%) | |
Consistency of condom use is slightly worse than consistency of the use of any method of contraception described in Section 2.4.1, though a simple majority of those relying on condoms as their exclusive method of contraception report using condoms every time. (Table 2.18)
2.4.3 Pill Use During Past 4 Weeks
| Total | Percentage | |||
|---|---|---|---|---|
| Est. | 95% C.I. | Est. | 95% C.I. | |
| Never missed | 6.17M | (5.02M, 7.33M) | 68.1% | (63.7%, 72.5%) |
| Missed only one | 1.66M | (1.26M, 2.06M) | 18.3% | (14.1%, 22.5%) |
| Missed two or more | 1.10M | (0.76M, 1.45M) | 12.2% | (9.0%, 15.3%) |
| Did not use pill over past 4 weeks | 0.08M | (0.02M, 0.15M) | 0.9% | (0.3%, 1.6%) |
| Don't know | 0.00M | (-0.00M, 0.01M) | 0.0% | (-0.0%, 0.1%) |
| No answer provided | 0.04M | (-0.01M, 0.09M) | 0.5% | (-0.1%, 1.0%) |
A majority of pill users report never missing a pill, though there is substantial amount of inconsistency of pill use among a minority of pill users. (Table 2.19)
2.5 Use of Contraceptive Methods for Other Reasons
Some users of methods of contraception are actually motivated by reasons other than contraception. The NSFG asks respondents about these other motives regarding condoms, and asks female respondents about these other motives regarding pills and IUDs.
2.5.1 Condom
| Total | Percentage | ||||
|---|---|---|---|---|---|
| Est. | 95% C.I. | Est. | 95% C.I. | ||
| Females | Yes | 16.4M | (14.5M, 18.2M) | 25.5% | (23.6%, 27.4%) |
| No | 47.4M | (42.1M, 52.7M) | 73.8% | (71.7%, 75.9%) | |
| Refused | 0.4M | (0.2M, 0.6M) | 0.6% | (0.2%, 1.0%) | |
| Don't know | 0.1M | (-0.0M, 0.2M) | 0.1% | (-0.1%, 0.2%) | |
| Males | Yes | 20.0M | (17.4M, 22.5M) | 32.0% | (29.8%, 34.3%) |
| No | 41.9M | (37.3M, 46.6M) | 67.3% | (65.1%, 69.6%) | |
| Refused | 0.4M | (0.2M, 0.6M) | 0.6% | (0.3%, 1.0%) | |
| Don't know | 0.0M | (-0.0M, 0.0M) | 0.0% | (-0.0%, 0.0%) | |
The size of the subdomain of condom users who are surveyed regarding their motives for condom use by the NSFG is approximately 16.4M females and 20.0M males. (Table 2.20) However, it should be noted this subdomain specifically contains users of condoms for vaginal intercourse with the opposite sex and does not address non-vaginal or same-sex condom use.
| Total | Percentage | ||||
|---|---|---|---|---|---|
| Est. | 95% C.I. | Est. | 95% C.I. | ||
| Females | For both reasons | 7.41M | (6.50M, 8.32M) | 45.3% | (40.8%, 49.7%) |
| To prevent pregnancy | 6.89M | (5.67M, 8.11M) | 42.1% | (37.7%, 46.5%) | |
| To prevent diseases like syphilis, gonorrhea or AIDS | 1.48M | (1.08M, 1.88M) | 9.1% | (6.8%, 11.3%) | |
| For some other reason | 0.57M | (0.33M, 0.82M) | 3.5% | (2.1%, 4.9%) | |
| Refused | 0.02M | (-0.01M, 0.04M) | 0.1% | (-0.1%, 0.3%) | |
| Males | For both reasons | 9.33M | (8.07M, 10.59M) | 46.8% | (43.3%, 50.2%) |
| To prevent pregnancy | 9.24M | (7.75M, 10.73M) | 46.3% | (42.6%, 50.0%) | |
| To prevent diseases like gonorrhea, chlamydia, syphilis, herpes or AIDS | 0.80M | (0.51M, 1.09M) | 4.0% | (2.6%, 5.4%) | |
| For some other reason | 0.44M | (0.26M, 0.63M) | 2.2% | (1.3%, 3.2%) | |
| Refused | 0.09M | (-0.02M, 0.20M) | 0.4% | (-0.1%, 1.0%) | |
| Don't know | 0.05M | (-0.02M, 0.12M) | 0.2% | (-0.1%, 0.6%) | |
The vast majority of persons who use condoms during vaginal intercourse are motivated by contraception at least in part, though these persons are split approximately equally between those who are exclusively motivated by contraception and those motivated by both contraception and prevention of sexually transmitted diseases. (Table 2.21)
2.5.2 Pill
| Total | Percentage | |||
|---|---|---|---|---|
| Est. | 95% C.I. | Est. | 95% C.I. | |
| Did not use pill | 61.6M | (55.5M, 67.7M) | 84.7% | (82.9%, 86.5%) |
| Used pill | 11.1M | (9.4M, 12.8M) | 15.3% | (13.5%, 17.1%) |
The size of the subdomain of pill users who are surveyed about their motives for pill use by the NSFG is approximately 11.1M females. (Table 2.22)
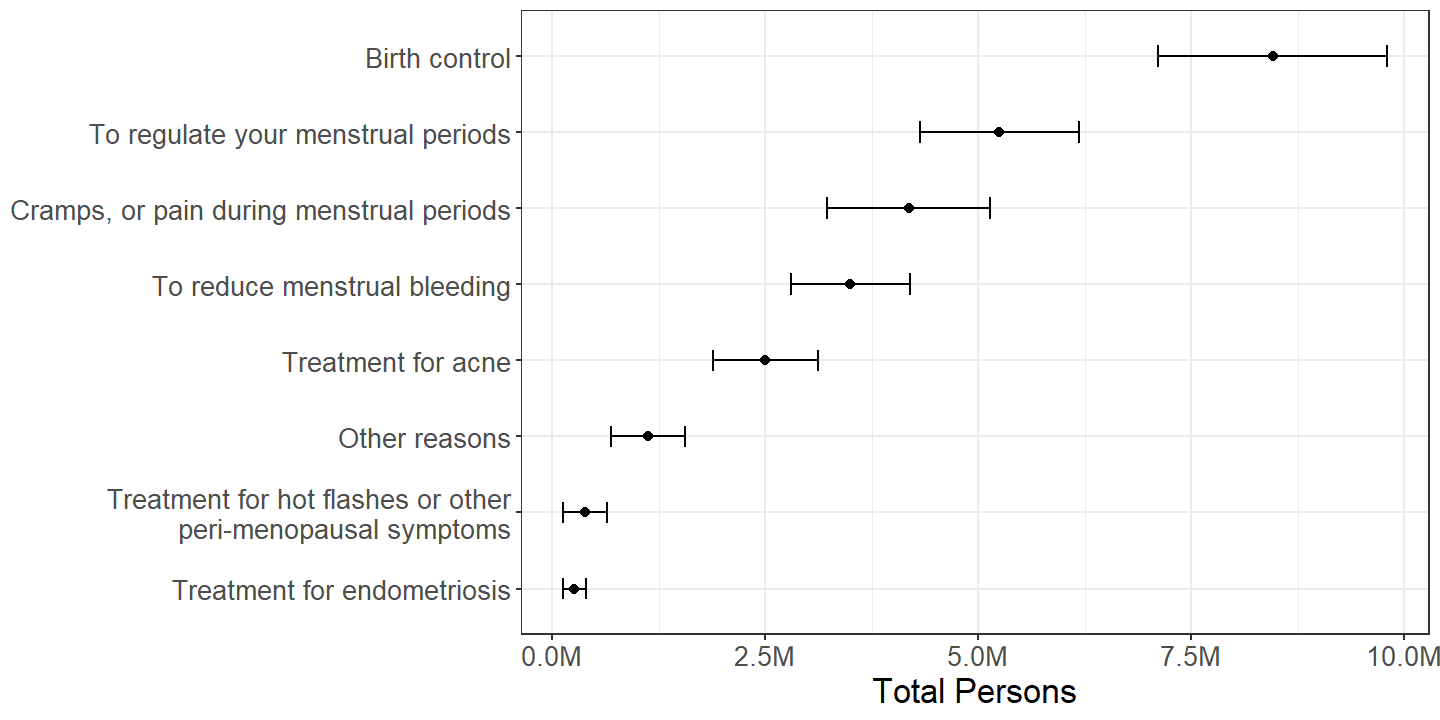
Figure 2.22: Females by reason(s) mentioned for using contraceptive pills with persons mentioning multiple reasons counted multiple times, among those who used pills either this or the previous month.
| Total | Percentage | |||
|---|---|---|---|---|
| Est. | 95% C.I. | Est. | 95% C.I. | |
| For both reasons | 5.62M | (4.49M, 6.75M) | 50.6% | (44.8%, 56.4%) |
| Only for birth control | 2.84M | (2.26M, 3.42M) | 25.6% | (21.2%, 29.9%) |
| Only for reasons other than contraception | 2.64M | (2.03M, 3.26M) | 23.8% | (19.9%, 27.8%) |
The most commonly mentioned reason for use of contraceptive pills is indeed birth control. (Figure 2.22) However, a minority of pill users mention birth control exclusively as a reason for their use. About half of all pill users are motivated both by birth control and other health reasons, and a substantial minority of pill users are motivated exclusively by reasons other than contraception. (Table 2.23)
2.5.3 Hormonal IUD
| Total | Percentage | |||
|---|---|---|---|---|
| Est. | 95% C.I. | Est. | 95% C.I. | |
| Did not use hormonal IUD | 67.4M | (61.1M, 73.7M) | 92.7% | (91.6%, 93.9%) |
| Used hormonal IUD | 5.3M | (4.2M, 6.4M) | 7.3% | (6.1%, 8.4%) |
The size of the subdomain of hormonal IUD users who are surveyed about their motives for hormonal IUD use by the NSFG is approximately 5.3M females. (Table 2.24)
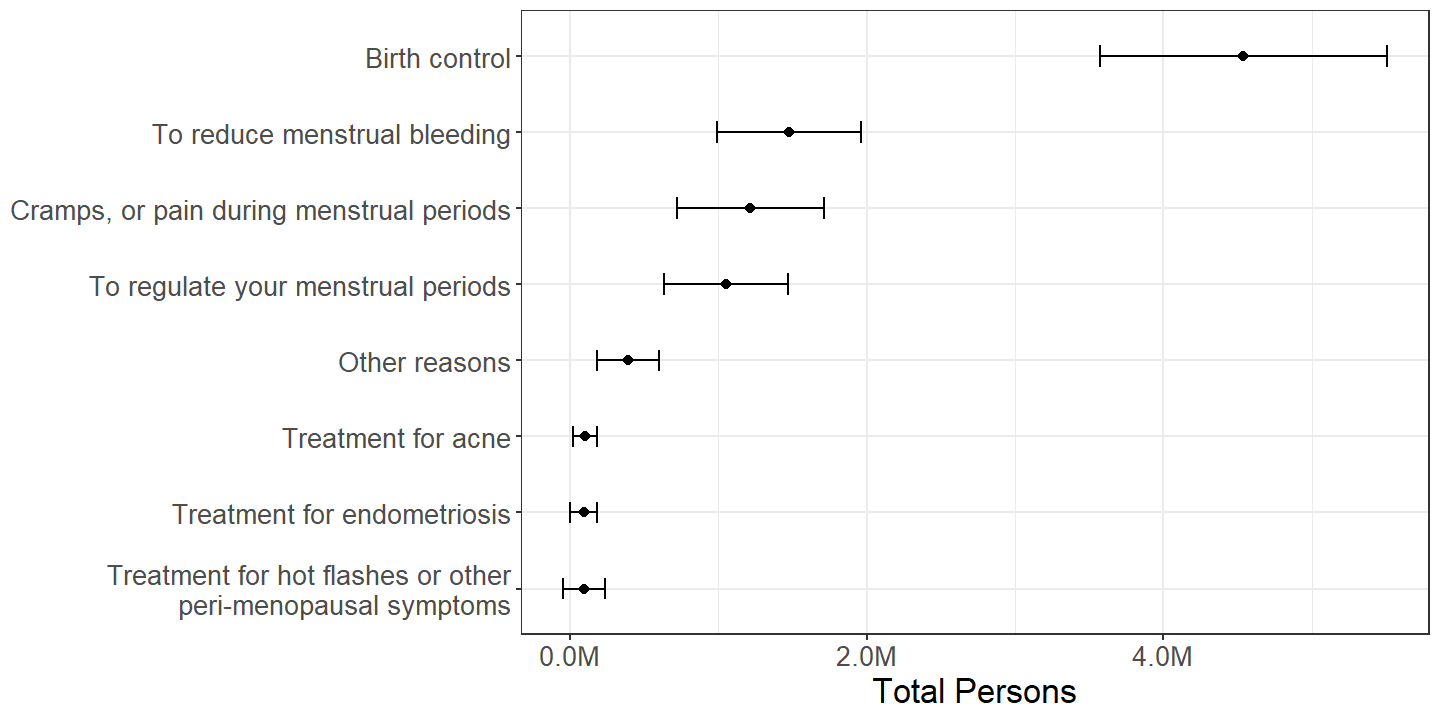
Figure 2.23: Females by reason(s) mentioned for using hormonal IUD with persons mentioning multiple reasons counted multiple times, among those who used an hormonal IUD either this or the previous month.
| Total | Percentage | |||
|---|---|---|---|---|
| Est. | 95% C.I. | Est. | 95% C.I. | |
| Only for contraception | 2.78M | (2.12M, 3.44M) | 52.5% | (45.6%, 59.5%) |
| For both reasons | 1.76M | (1.27M, 2.25M) | 33.2% | (27.5%, 39.0%) |
| Only for reasons other than contraception | 0.75M | (0.44M, 1.05M) | 14.1% | (9.6%, 18.6%) |
| Don't know | 0.01M | (-0.01M, 0.02M) | 0.1% | (-0.1%, 0.4%) |
The most commonly mentioned reason for use of hormonal IUD is birth control. (Figure 2.23) For approximately half of hormonal IUD users, contraception is the sole motivation for use of an hormonal IUD, but approximately a third of hormonal IUD users are motivated by other health reasons in addition to birth control, and a minority of hormonal IUD users are motivated exclusively by reasons other than contraception. (Table 2.25)
2.6 Use of Contraception Ever During Lifetime
Female respondents to the NSFG are asked whether they have ever used specific methods of contraception ever in their lifetimes. As was seen in Section 2.5, sometimes contraceptive methods are used for reasons other than contraception. The total counts of persons who have ever used certain methods are thus greater when considering the general population than when considering those who have had sexual intercourse with the opposite sex. Therefore, this section twice estimates persons who have ever used contraceptives, once among all females in the NSFG population and once among those who have had sexual intercourse with the opposite sex.
| Total | Percentage | |||
|---|---|---|---|---|
| Est. | 95% C.I. | Est. | 95% C.I. | |
| Used a method of contraception | 65.32M | (58.83M, 71.82M) | 89.9% | (88.8%, 91.0%) |
| Never have used a method of contraception | 7.35M | (6.36M, 8.34M) | 10.1% | (9.0%, 11.2%) |
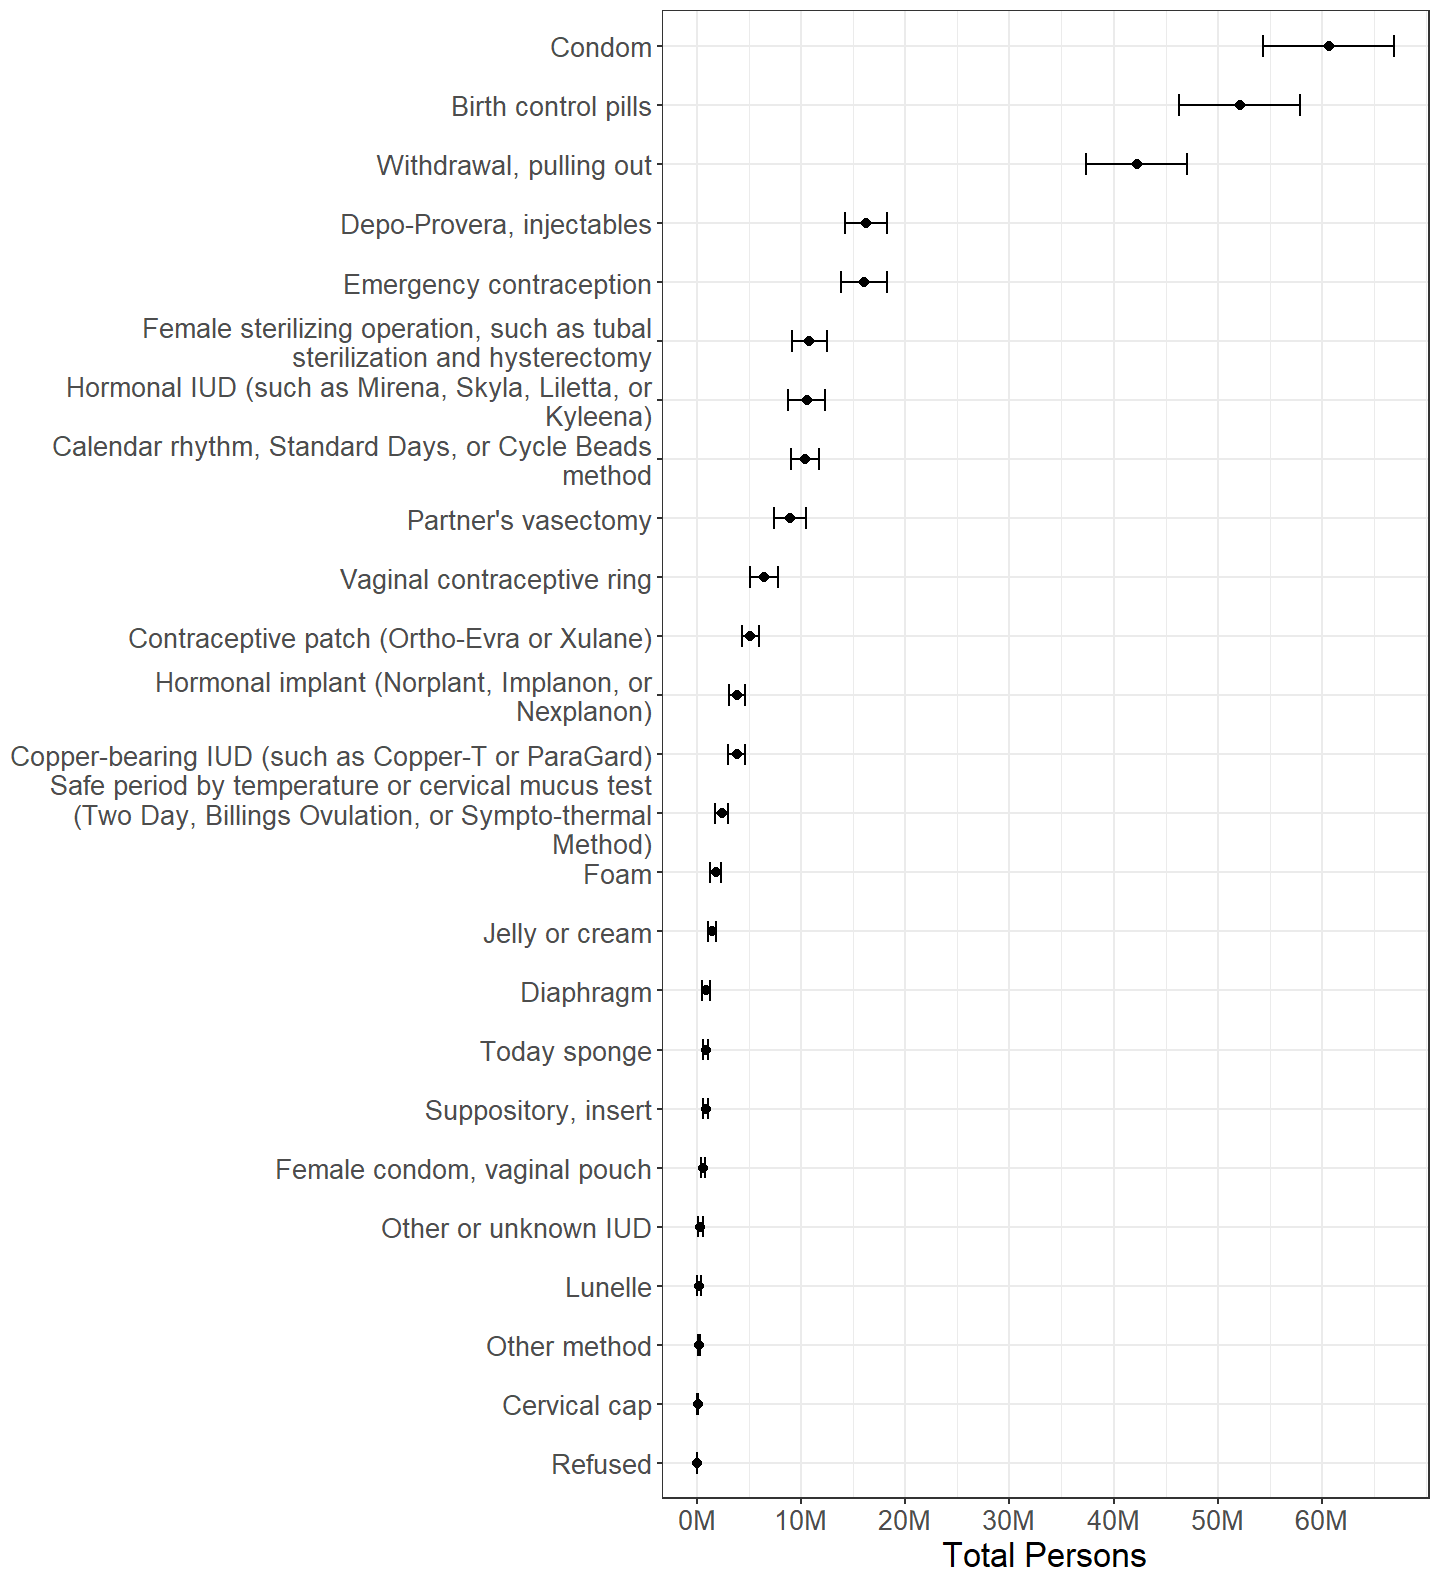
Figure 2.24: Females categorized by whether or not each contraceptive method was ever used, with persons using multiple methods counted multiple times.
Approximately 89.9% of females have used at least one method of contraception at some time in their lives. (Table 2.26) Condom, pill, and withdrawal methods are the most common methods ever used by females. (Figure 2.24)
2.6.1 Among Those Who Have Ever Had Intercourse
| Total | Percentage | |||
|---|---|---|---|---|
| Est. | 95% C.I. | Est. | 95% C.I. | |
| Has had intercourse | 64.0M | (57.5M, 70.5M) | 88.0% | (86.8%, 89.2%) |
| Never had intercourse | 8.7M | (7.7M, 9.7M) | 12.0% | (10.8%, 13.2%) |
| Total | Percentage | |||
|---|---|---|---|---|
| Est. | 95% C.I. | Est. | 95% C.I. | |
| Used a method of contraception | 63.4M | (56.9M, 69.9M) | 99.1% | (98.8%, 99.5%) |
| Never have used a method of contraception | 0.6M | (0.3M, 0.8M) | 0.9% | (0.5%, 1.2%) |
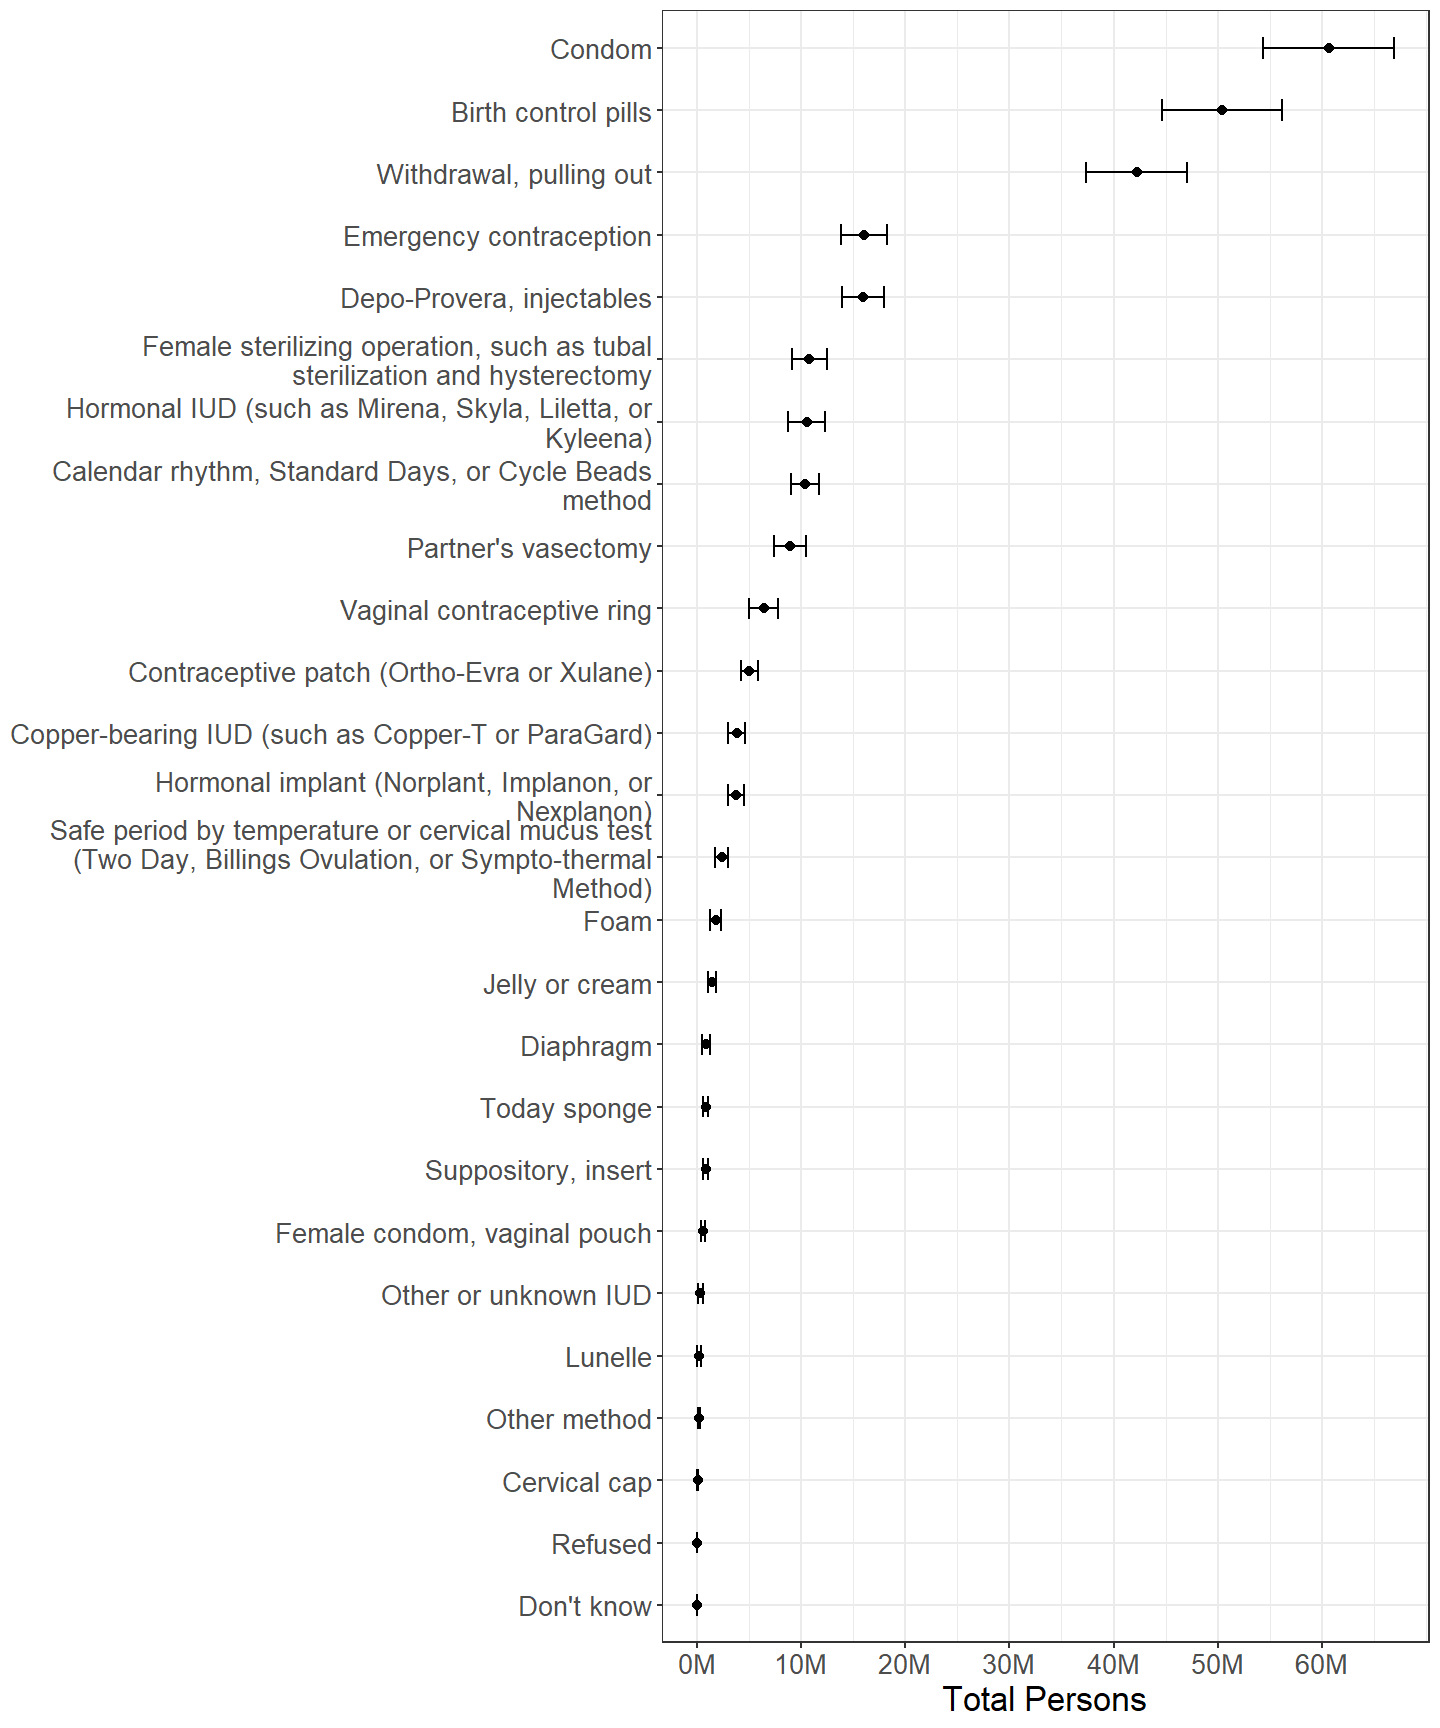
Figure 2.25: Females categorized by whether or not each contraceptive method was ever used, with persons using multiple methods counted multiple times, among those who have ever had intercourse with someone of the opposite sex.
There are approximately 64.0M females who have ever had intercourse with someone of the opposite sex. (Table 2.27) Of these, approximately 99.1% have used a method of contraception at least once in their lives. (Table 2.28) The major difference between the totals estimated in Figure 2.25 and Figure 2.24 is that the estimates in 2.25 are slightly lower for some methods, such as birth control pills, owing to persons who have never had sexual intercourse with someone of the opposite sex using these methods for reasons other than contraception.
2.7 Discontinuation Due to Dissatisfaction
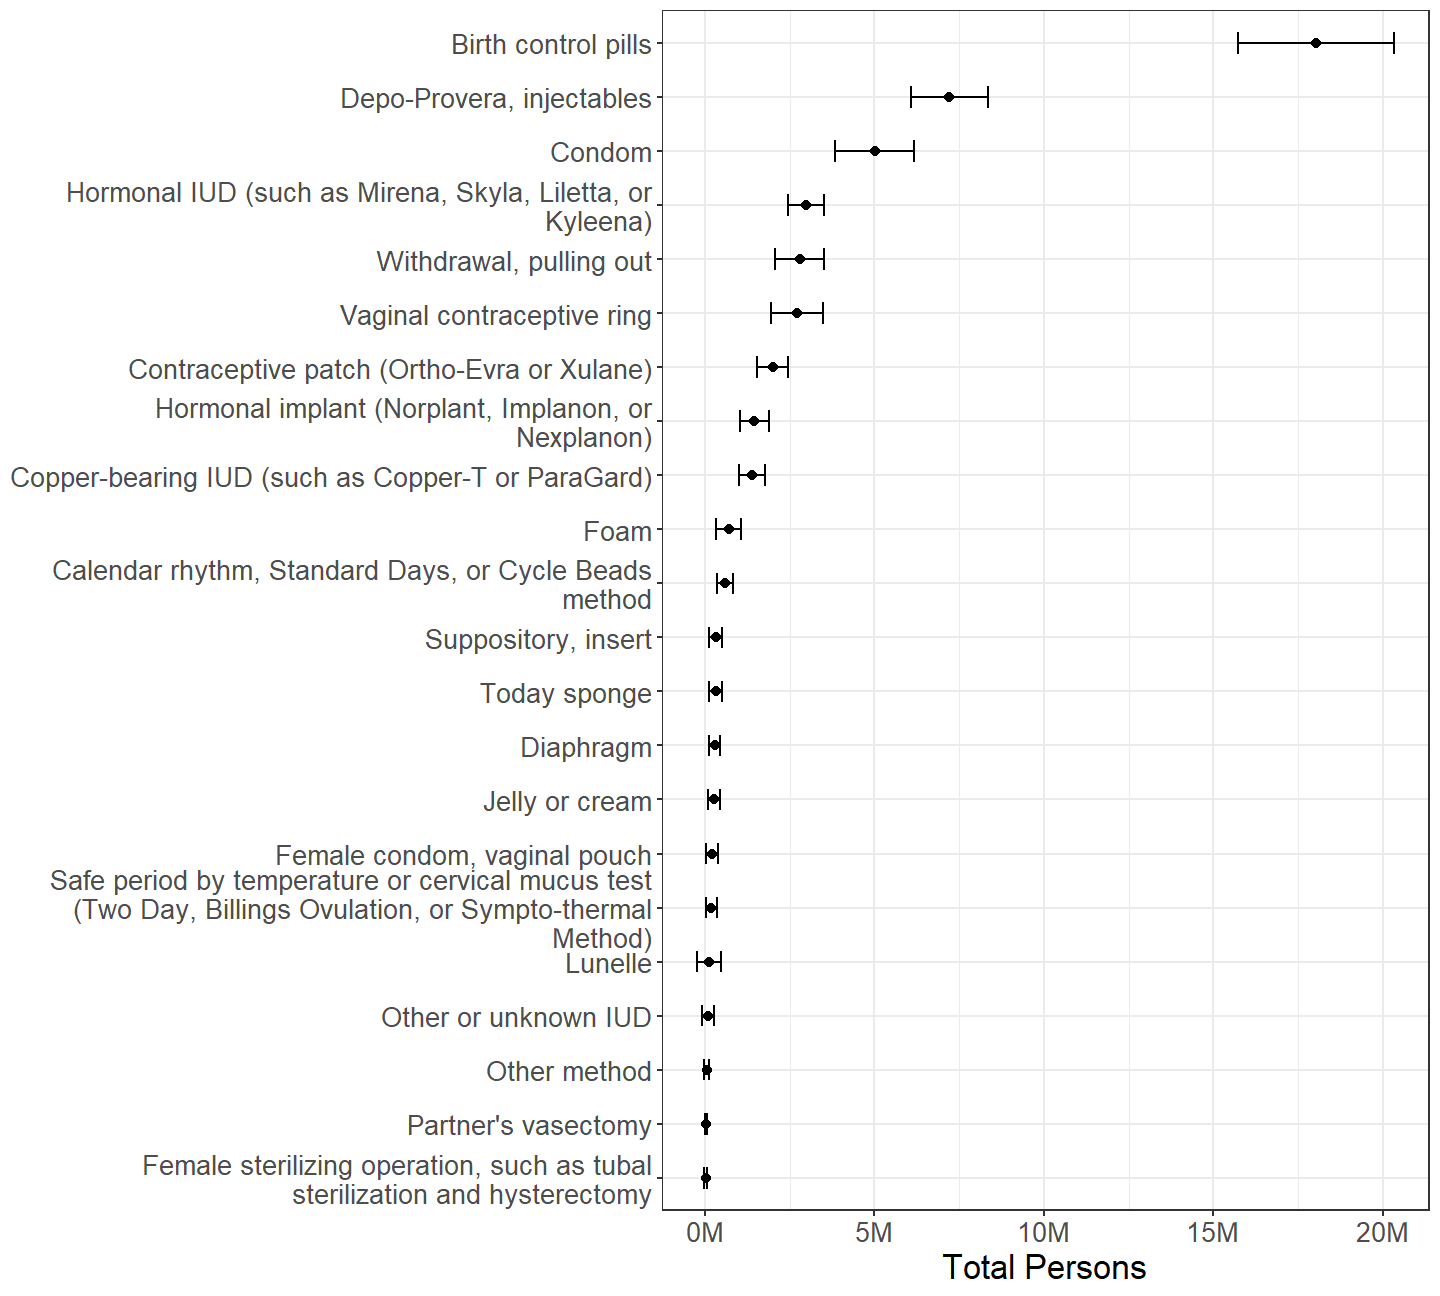
Figure 2.26: Females by whether or not they have discontinued using each contraceptive method due to dissatisfaction, with persons using discontinuing multiple methods counted multiple times.
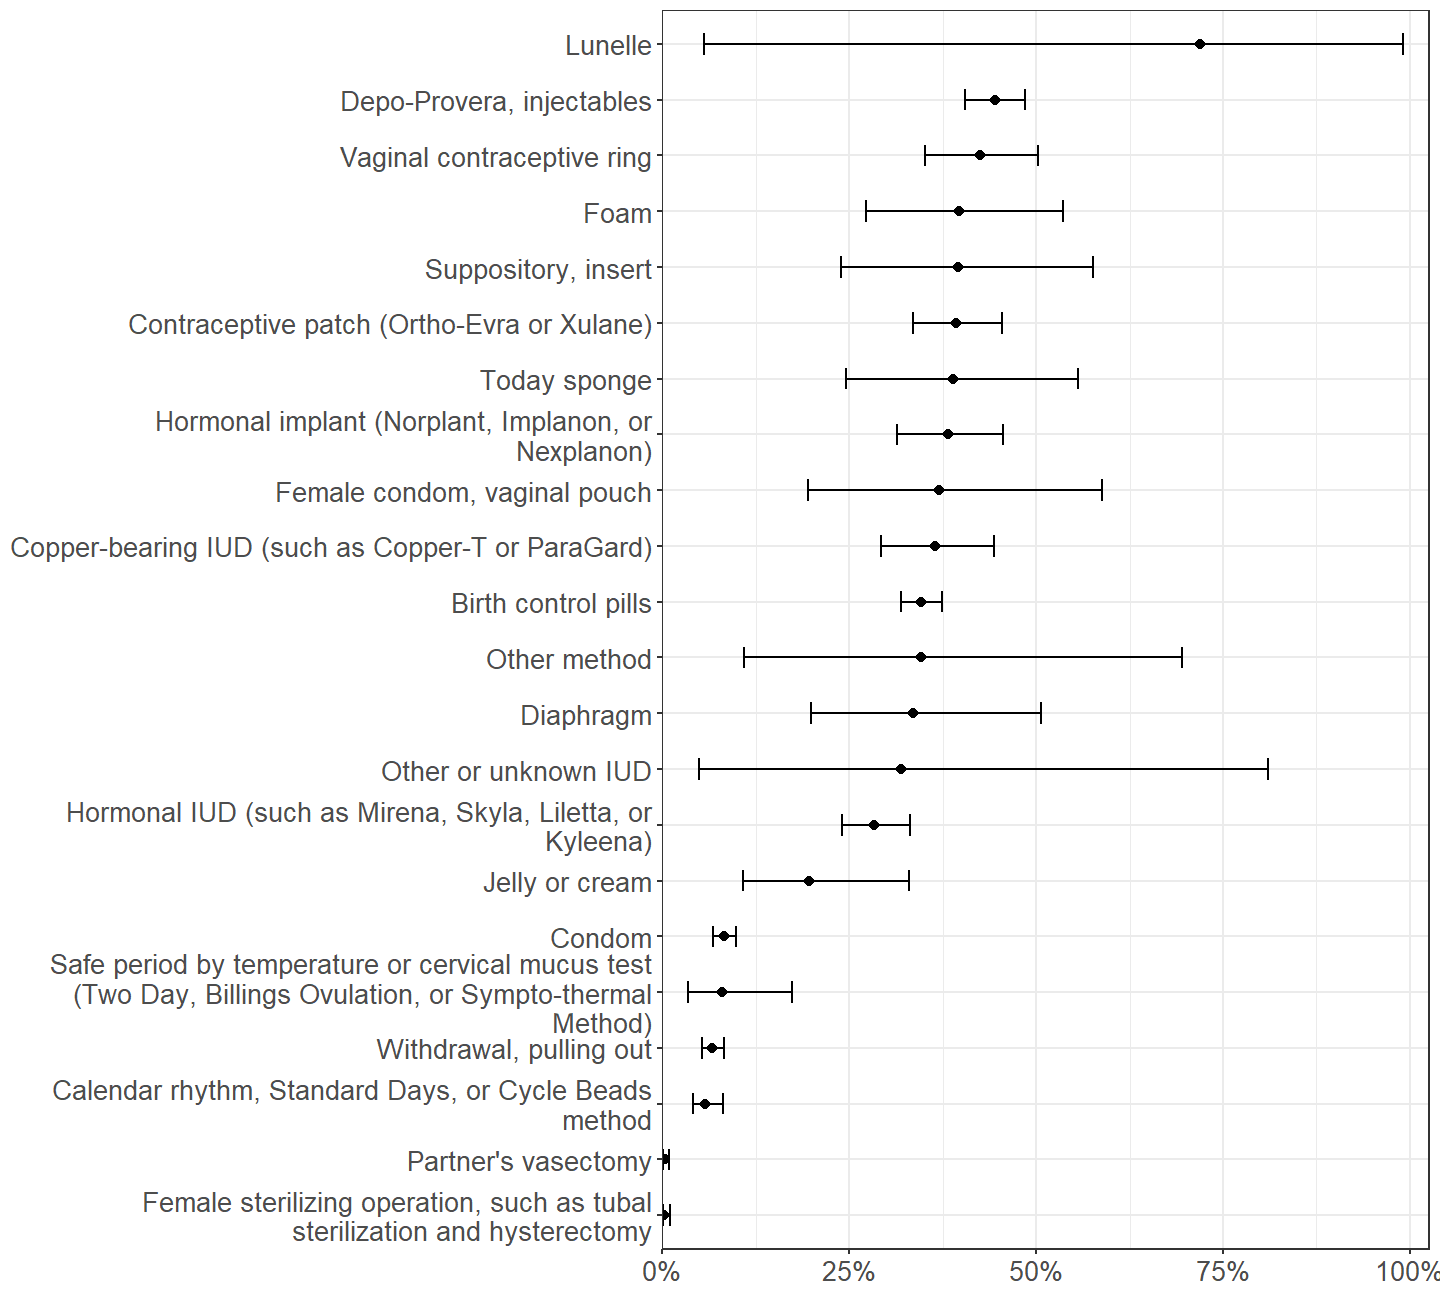
Figure 2.27: Proportion of females who have discontinued using each contraceptive method due to dissatisfaction, among those who have ever used each method of contraception.
The NSFG asks female respondents whether they have ever discontinued use of contraceptive methods due to dissatisfaction. While birth control pills have a discontinuation rate that is near the median of discontinuation rates (Figure 2.27), the popularity of pills leads to pills being the most discontinued method of contraception. (Figure 2.26) Similarly, condoms have one of the lowest discontinuation rates, but still are the third most discontinued method. On the other hand, injectables have a relatively high discontinuation rate and are the second most discontinued method.
Some methods, such as Lunelle, are so rarely used by respondents to the NSFG that the sampling error associated with estimating their discontinuation rate is too large for useful estimates.
The following subsections examine reasons for dissatisfaction leading to discontinuation of condoms, pills, and IUDs. Reasons for dissatisfaction were asked of NSFG respondents in two steps. In the first, respondents were asked to select one or more reasons from a prefabricated list of possible reasons. The second step gave the respondent an opportunity to describe reasons in their own words and occurred if the respondent selected any of the reasons “too difficult to use,” “side effects,” or “other.”
2.7.1 Condom
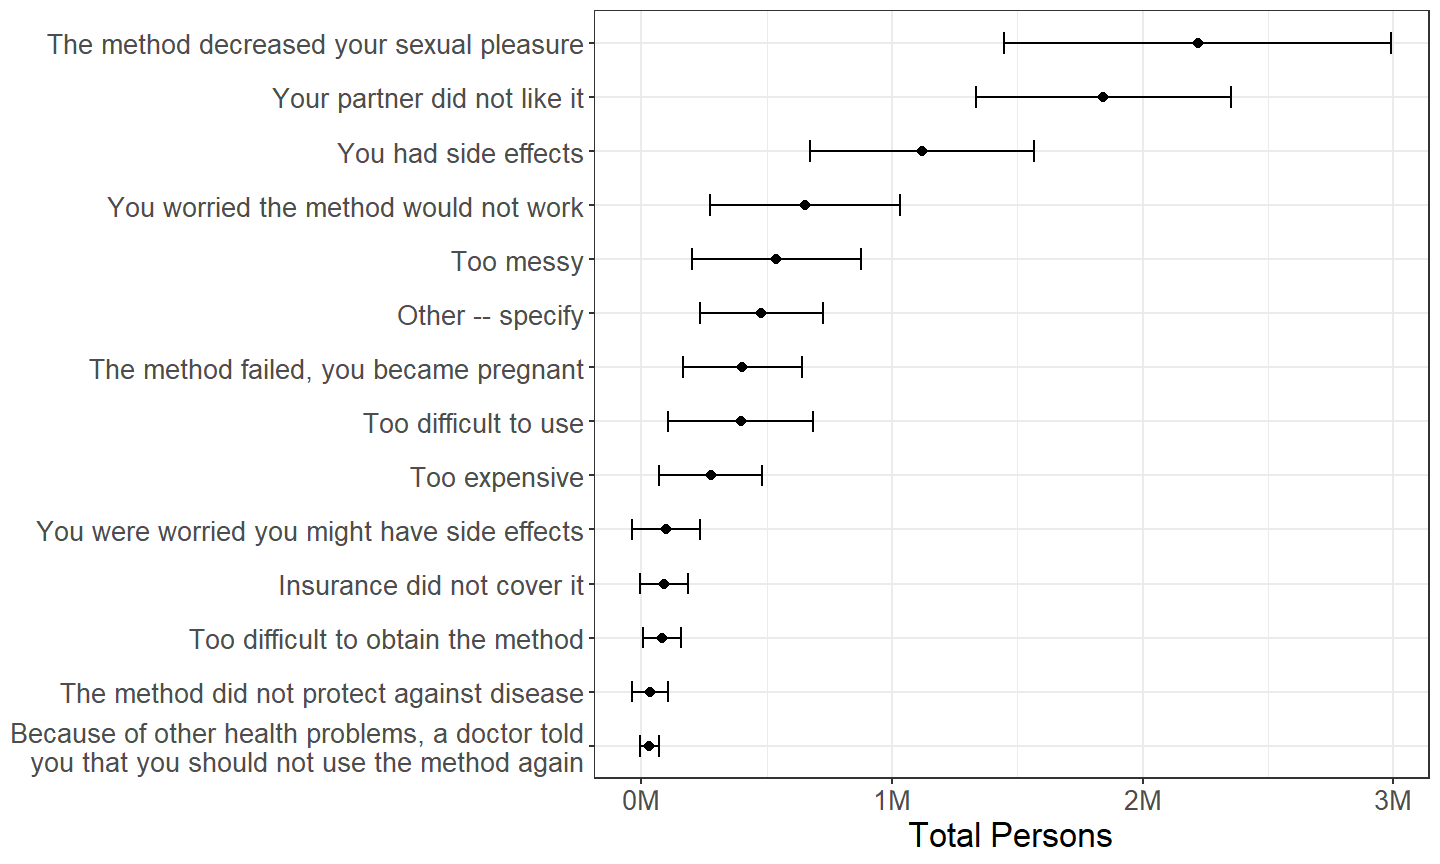
Figure 2.28: Females categorized by reason for dissatisfaction with condoms, with persons mentioning multiple reasons counted multiple times, among those who have ever discontinued using condoms due to dissatisfaction.
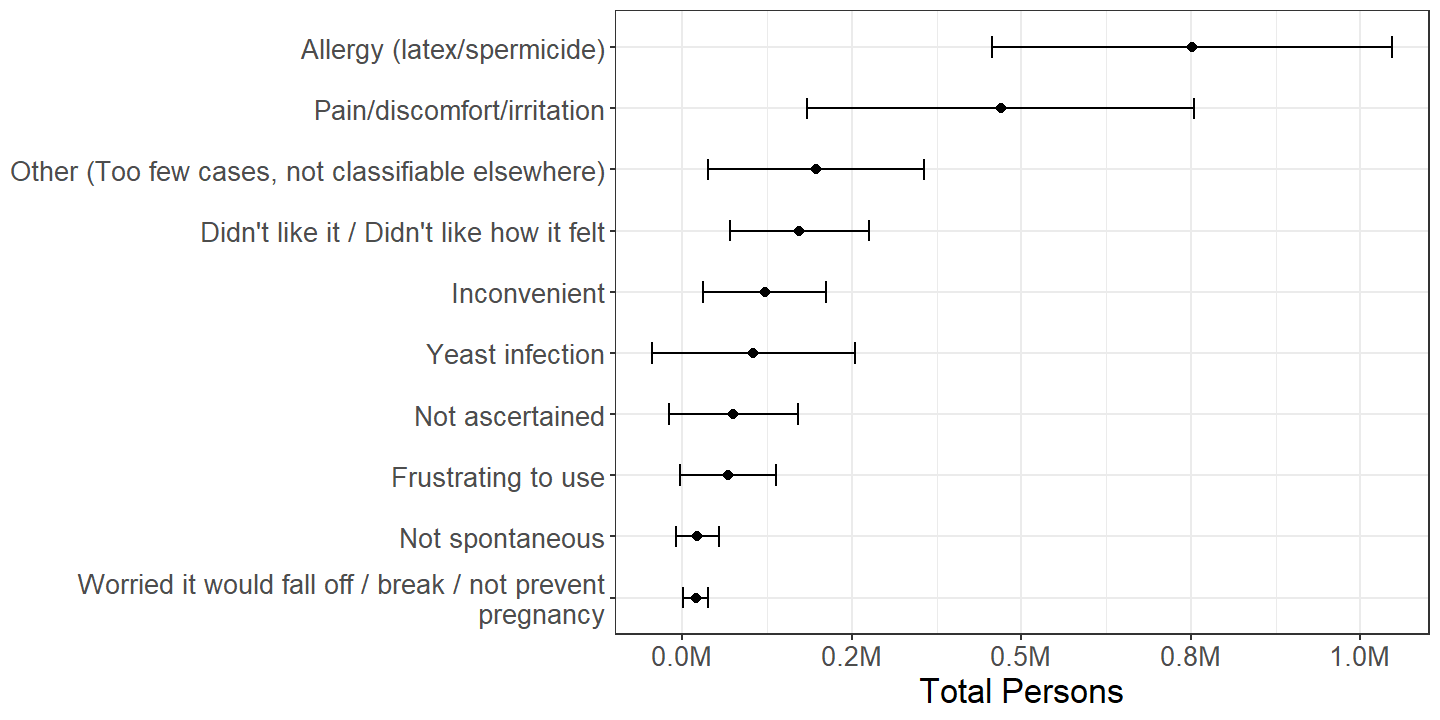
Figure 2.29: Females categorized by reason described for dissatisfaction with condoms, with persons mentioning multiple reasons counted multiple times, among those who have ever discontinued using condoms due to dissatisfaction for reasons “too difficult to use,” “side effects,” or “other.”
When condoms are discontinued due to dissatisfaction, the most common reasons are due to decrease in sexual pleasure or dislike from male partners, though a nontrivial number of persons report experiencing side effects. (Figure 2.28) The most common side effects are allergy or discomfort. (Figure 2.29)
2.7.2 Pill
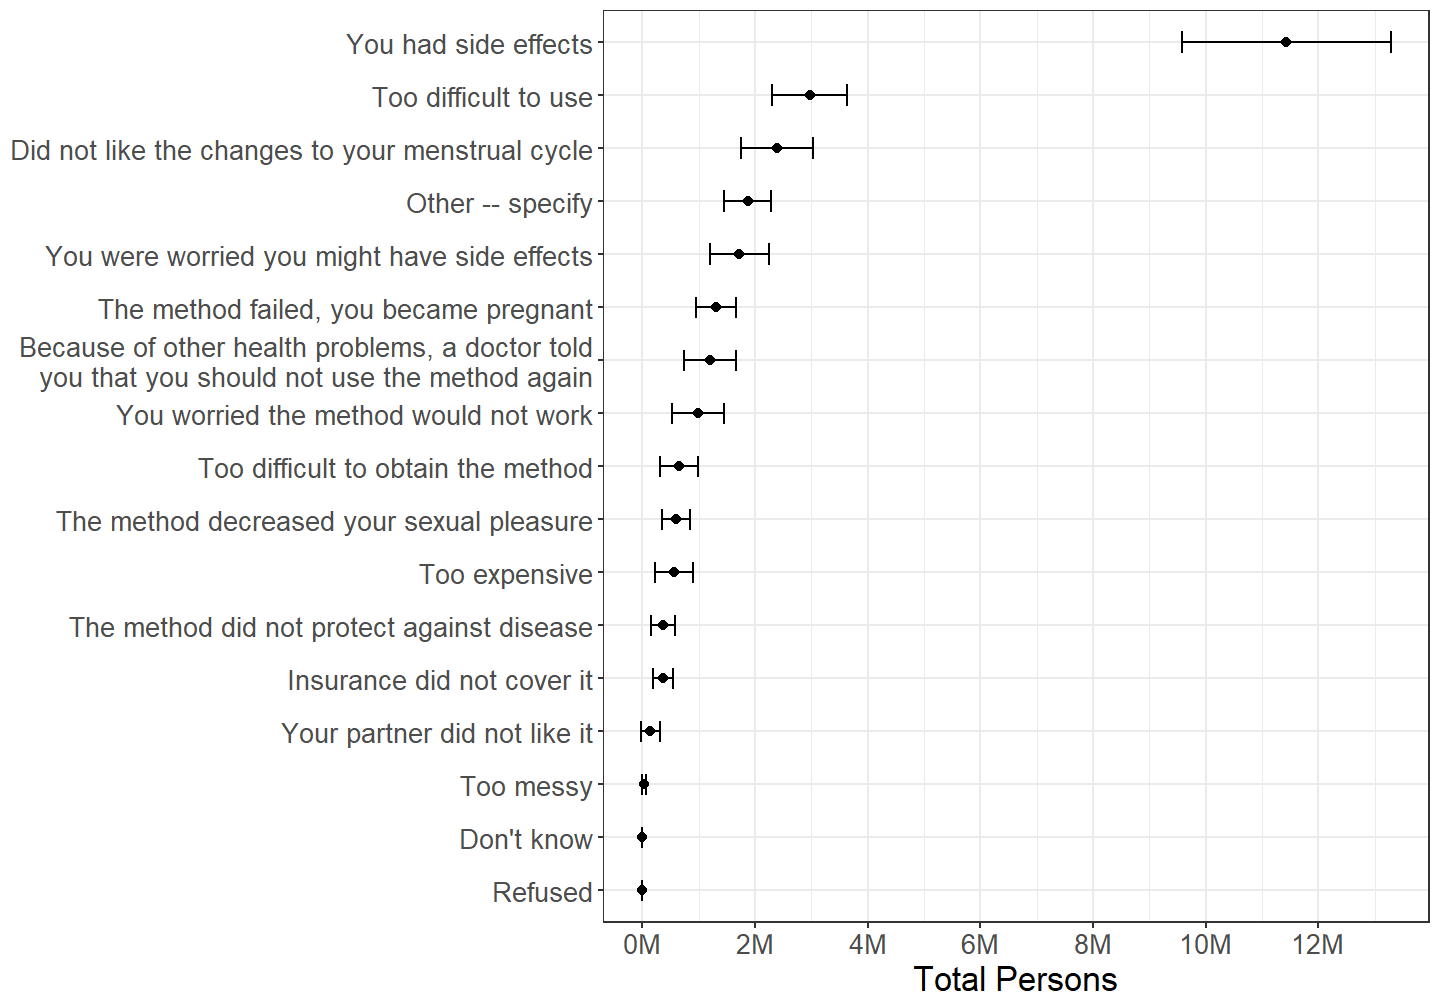
Figure 2.30: Females categorized by reason for dissatisfaction with contraceptive pills, with persons mentioning multiple reasons counted multiple times, among those who have ever discontinued using pills due to dissatisfaction.
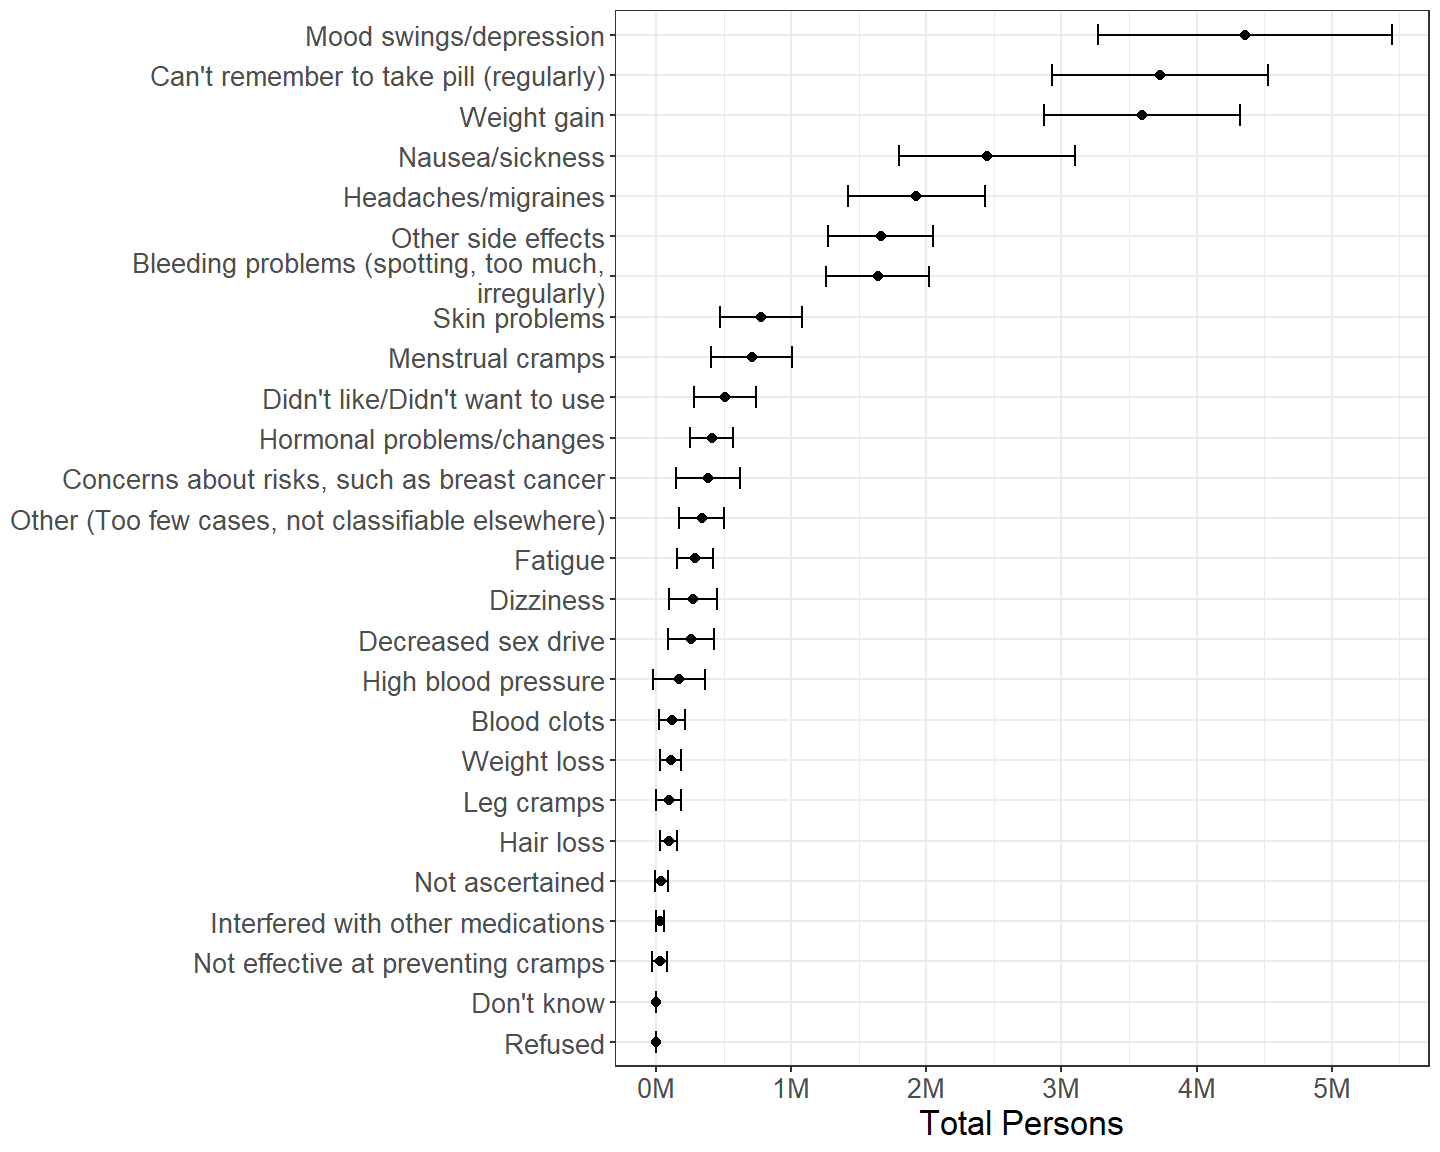
Figure 2.31: Females categorized by reason described for dissatisfaction with condoms, with persons mentioning multiple reasons counted multiple times, among those who have ever discontinued using condoms due to dissatisfaction for reasons “too difficult to use,” “side effects,” or “other.”
Side effects are by far the most commonly reported reason for discontinuation of contraceptive pills. (Figure 2.30) Side effects are varied, but mood, weight gain, or nausea issues are commonly reported. (Figure 2.31) It is also commonly reported that pills are too difficult to use or that persons cannot remember to take pills regularly.
2.7.3 IUD
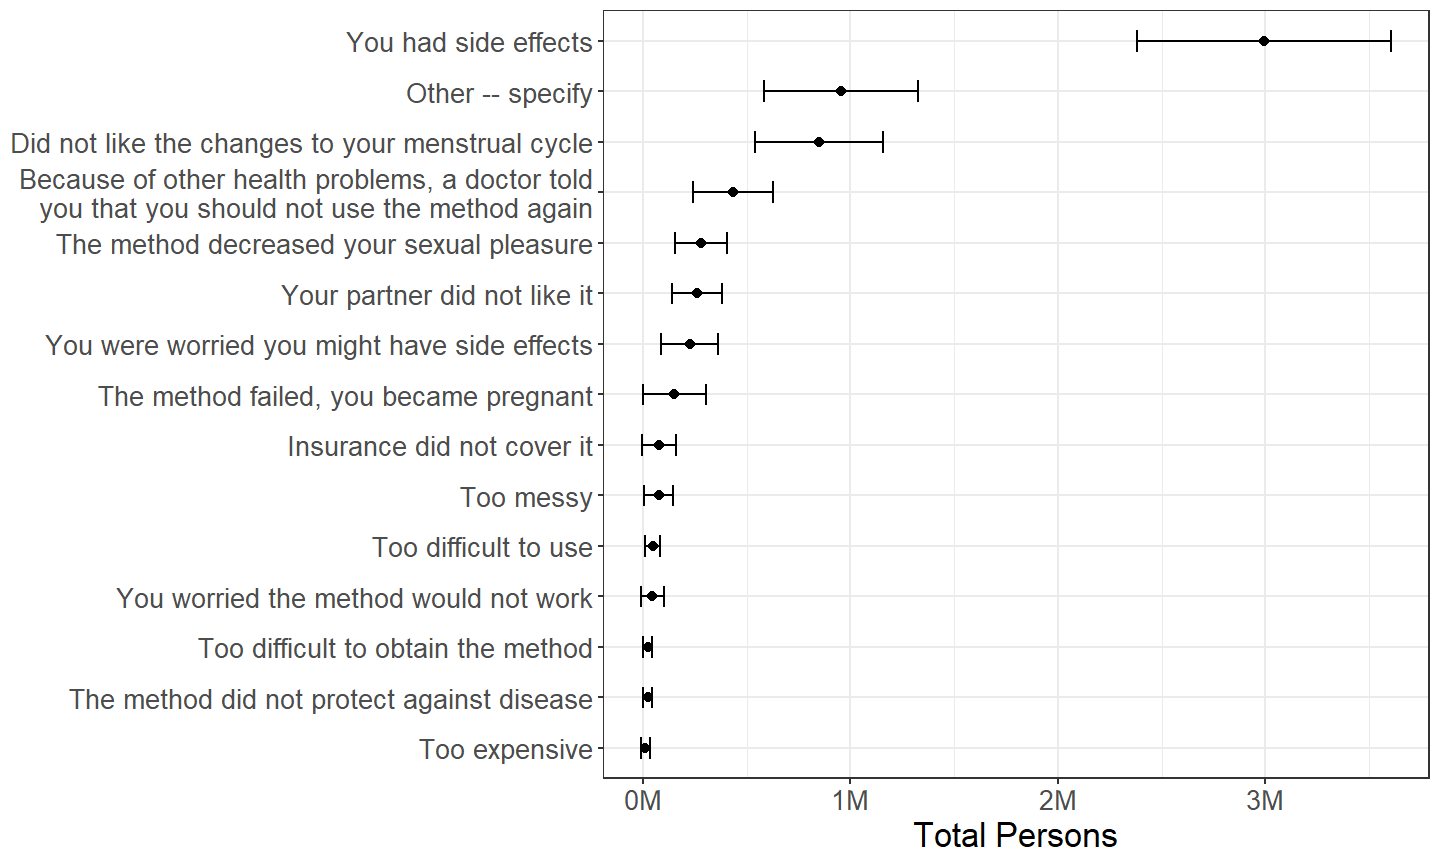
Figure 2.32: Females categorized by reason for dissatisfaction with IUDs, with persons mentioning multiple reasons counted multiple times, among those who have ever discontinued using an IUD due to dissatisfaction.
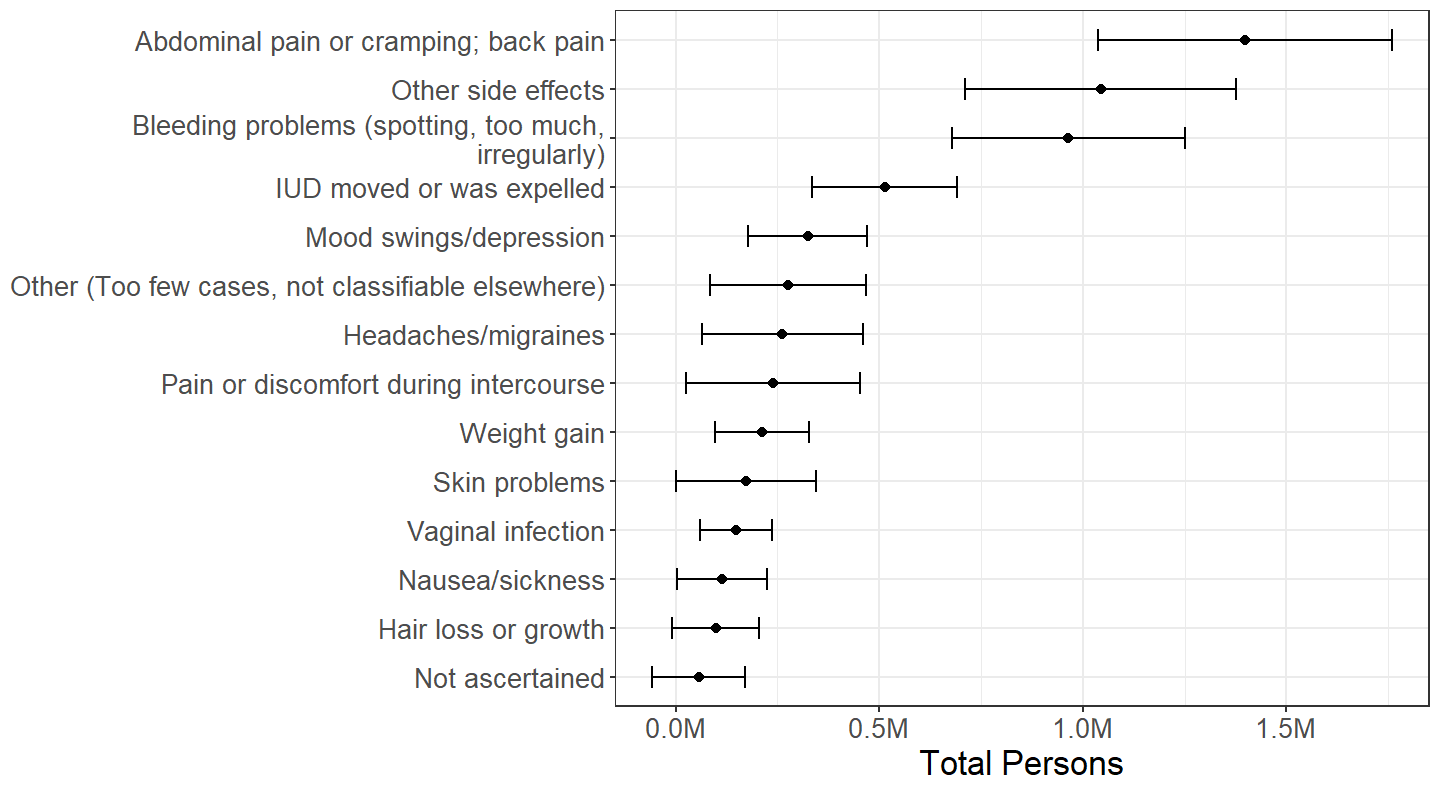
Figure 2.33: Females categorized by reason described for dissatisfaction with IUDs, with persons mentioning multiple reasons counted multiple times, among those who have ever discontinued using a IUD due to dissatisfaction for reasons “too difficult to use,” “side effects,” or “other.”
Like with contraceptive pills, side effects are by far the most commonly reported reason for discontinuation of IUDs. (Figure 2.32) For IUDs, commonly reported side effects involve abdominal pain or bleeding. (Figure 2.33)
2.8 Reason(s) for Not Currently Using Contraception
The respondents who did use contraception during their last intercourse despite being at risk of unintended pregnancy that were identified in Section 2.2.1 were not specifically asked as part of the NSFG about their reasons for not using contraception. However, a series of questions were asked of female respondents who did not report pregnancy or use of any method of contraception in the month of the interview, but did report having a current partner and having sexual intercourse with someone of the opposite sex in the month of the interview. There are approximately 5.76M females in this subdomain, with a 95% confidence interval for this estimate of (4.99M, 6.54M).
Unfortunately, the results of this line of questioning on the NSFG are uninformative due to both sampling error and measurement error.
2.8.1 Intent to Conceive
| Total | Percentage | |||
|---|---|---|---|---|
| Est. | 95% C.I. | Est. | 95% C.I. | |
| Wants to get pregnant | 2.71M | (2.18M, 3.25M) | 47.1% | (40.1%, 54.2%) |
| Partner wants respondent to get pregnant | 0.66M | (0.40M, 0.92M) | 11.4% | (7.2%, 15.6%) |
| Don't know | 0.02M | (-0.00M, 0.05M) | 0.4% | (-0.1%, 0.9%) |
| Refused | 0.01M | (-0.01M, 0.04M) | 0.3% | (-0.3%, 0.8%) |
| Not intending to conceive | 2.33M | (1.85M, 2.80M) | 40.4% | (34.3%, 46.5%) |
| No answer provided | 0.03M | (-0.02M, 0.07M) | 0.4% | (-0.3%, 1.1%) |
Among those in this subdomain, a substantial minority do not have any intent to become pregnant and so are at risk for unintended pregnancy. (Table 2.29)
2.8.2 Reason(s) for Nonuse When Not Intending to Conceive
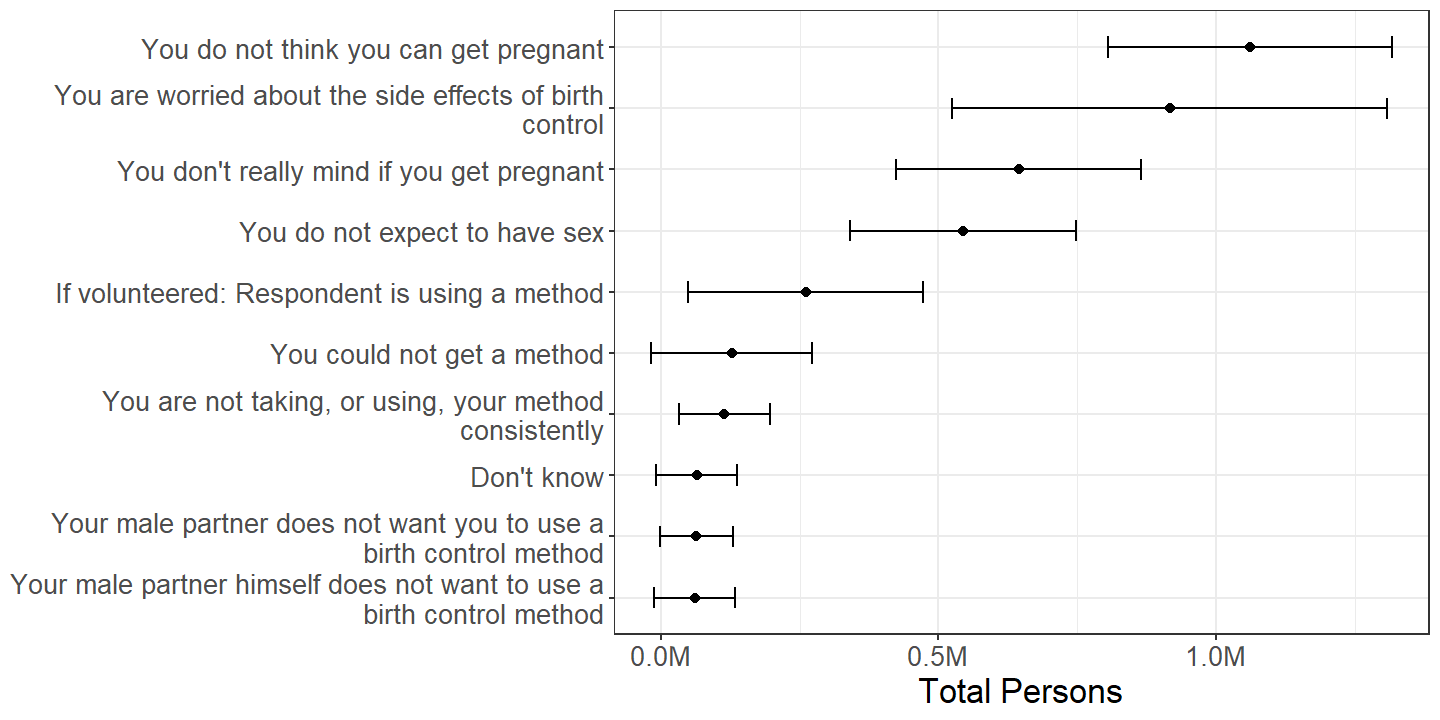
Figure 2.34: Females categorized by reason(s) for not using contraception, with persons reporting multiple reasons counted multiple times, among those at increased risk for unintended pregnancy due to contraceptive nonuse.
A nontrivial number of up to half a million persons are falsely included in this subdomain, because some respondents to the NSFG spontaneously respond that they actually are using a method of contraception when asked why they are not. (Figure 2.34) This is evidence of an opposite type of measurement error to that found in Section 2.4.1.
Because there are a relatively few number of persons estimated in Figure 2.34, the effective sample size is small, leading to large sampling errors. Nonetheless, a person’s belief she cannot get pregnant is either the most common or one of the most common reasons for not using contraception. This itself is another form of measurement error because respondents are elsewhere asked whether they are physically unable to conceive, and if so, are not asked this series of questions.
2.8.3 Reason(s) Respondent Believes She Cannot Become Pregnant
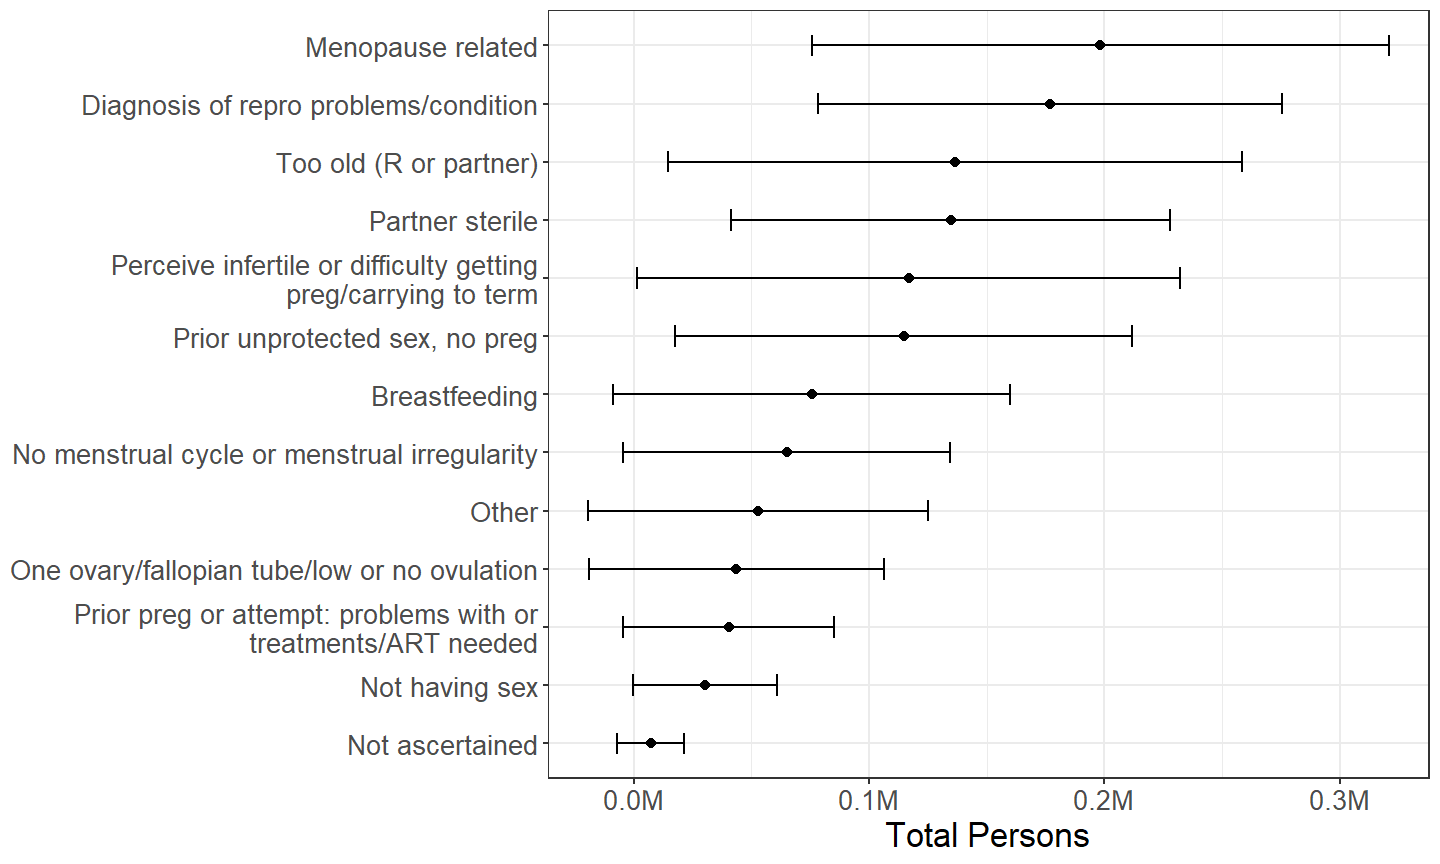
Figure 2.35: Females categorized by reason(s) they believe they cannot become pregnant, with persons using reporting multiple reasons counted multiple times, among those who select “you do not think you can get pregnant” as a reason for contraceptive nonuse.
Among the approximately million females who select “you do not think you can get pregnant” as a reason for not using contraception, there is no clearly most common reason for the belief that becoming pregnant is impossible. (Figure 2.35) Some answers, such as having prior unprotected sexual intercourse without a pregnancy, are likely spurious reasons to believe pregnancy is impossible, while others, such as medical diagnosis of a reproductive condition, should have led to respondents reporting their physical infertility earlier in the NSFG questioning.
2.9 Age for Female Sterilizing Operations
One of the more salient differences in reporting of contraceptive use between females and males is in reporting of female sterilizing operations such as tubal ligation. As Section 3.1 discusses, one confounding variable in this may be the age at which females undergo sterilizing operations.
The average7 age at which females living in households in the United States have sterilizing operations is approximately
| mean |
|---|
| 30.4 |
years, with a 95% confidence interval of (29.8, 31.0) years.
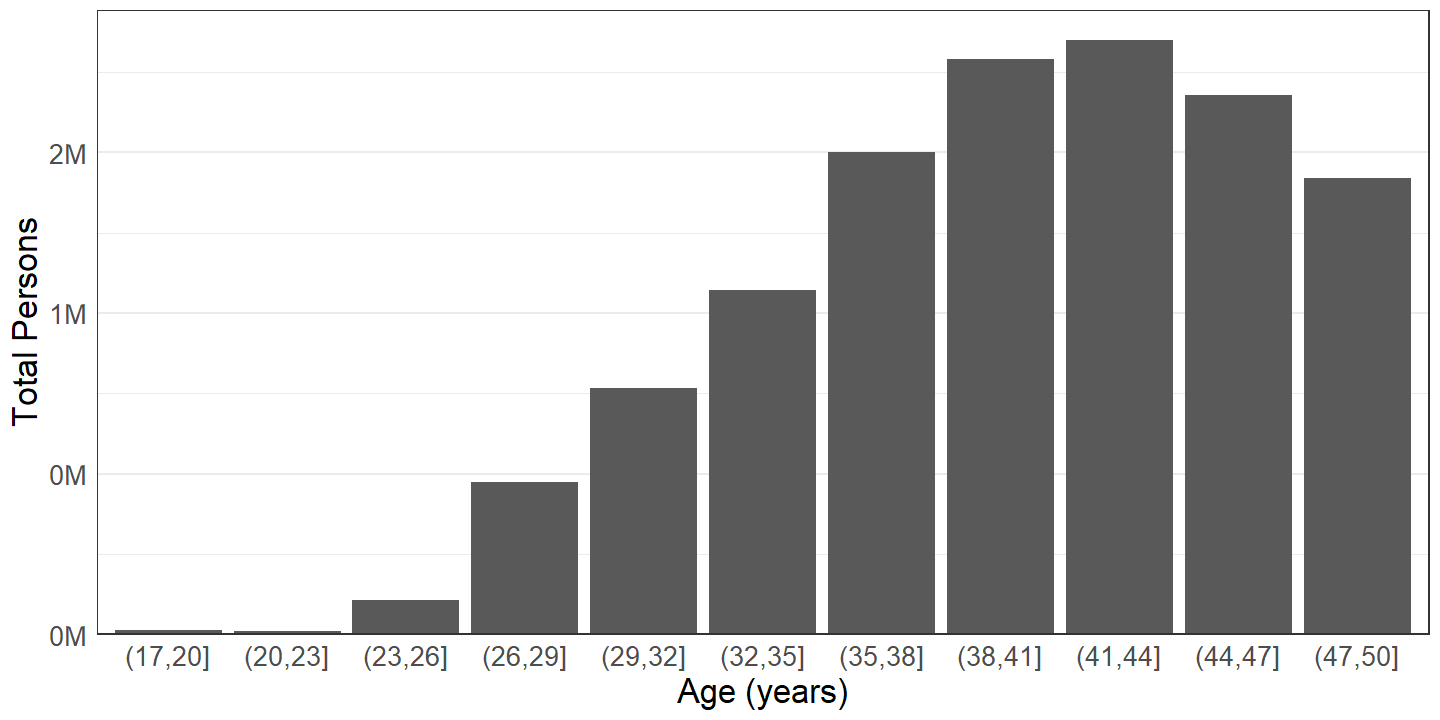
Figure 2.36: Total number of females who have had sterilizing operations, by age.
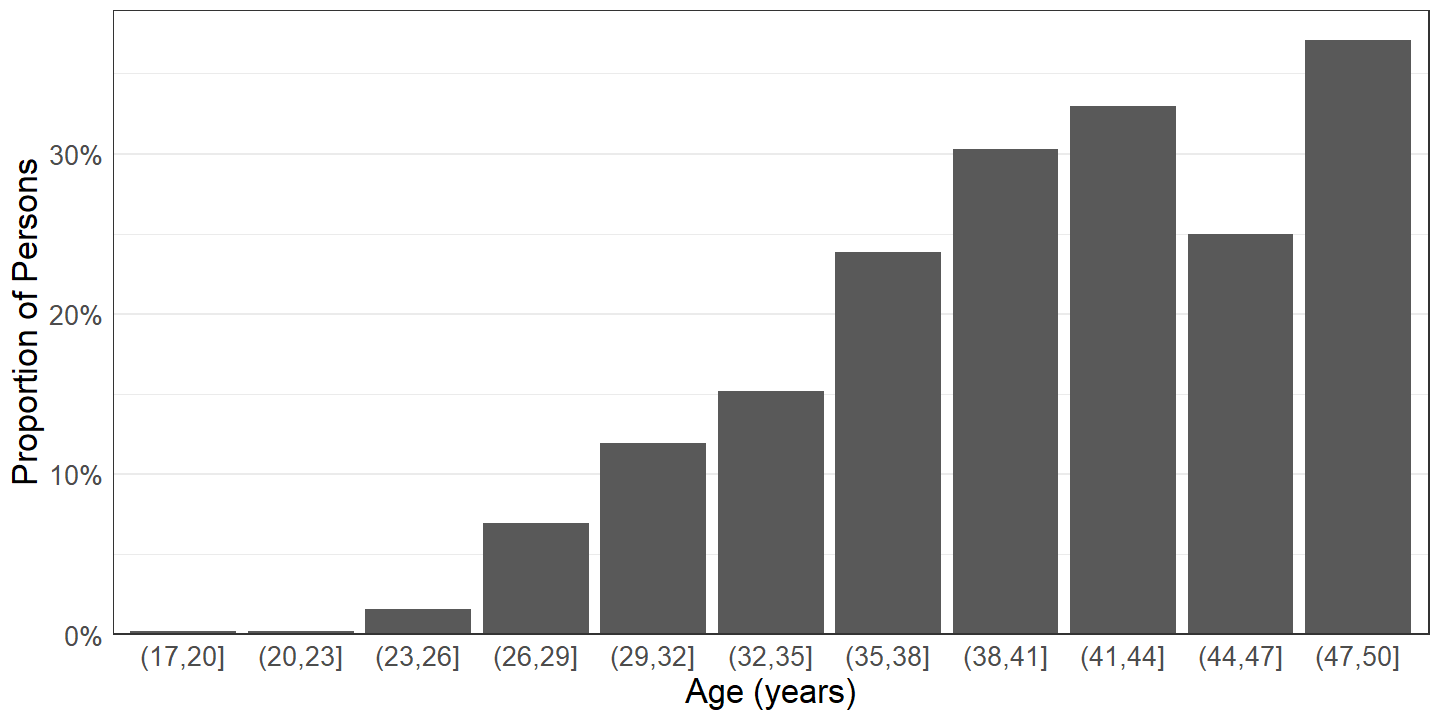
Figure 2.37: Proportion of females who have had sterilizing operations, by age.
The number of females who have had sterilizing operations such as tubal ligation increases with age group until the early forties, then declines slightly. (Figure 2.36) The proportion of females in each group that have had sterilizing operations increases with age, with the exception of an aberration in the (44, 47] years age group. (Figure 2.37) Thus, older females are more likely to have had a sterilizing operation than younger persons.
3 Discussion
Contraception is a nearly ubiquitous part of the reproductive behavior of persons living in the United States. More than three quarters of those sexually active with someone of the opposite sex used contraception during their most recent intercourse. (Section 2.2) Among females who have ever had sexual intercourse with a male, approximately 99% have used a method of contraception at least once in their lives. (Section 2.6.1)
Despite the overall prevalence of contraception, at any given time, millions of persons neglect to use contraception during their most recent sexual intercourse despite being at risk for unintended pregnancy. (Section 2.2.1) This is the case, at least in part, because there is much inconsistency in contraceptive use. (Section 2.4)
This inconsistency occurs even though persons living in the United States compose a population that has abundant access to contraceptive methods. Among the over 5 million females not currently using contraception despite being at risk for unintended pregnancy, less than 250 thousand are not using a method of contraception because they could not get a method. (Section 2.8)
Furthermore, there is much dissatisfaction with contraceptive methods currently available. For instance, birth control pills are one of the most common methods of contraception in the United States and near the median in discontinuation rate among methods, but approximately a third of females who have ever used birth control pills have discontinued use due to dissatisfaction. (Section 2.7)
Condoms, pills, and female sterilizing operations are the most prevalent methods of contraception in the United States, and withdrawal, vasectomy, and IUDs are the next most prevalent methods. The exact ordering of prevalence of these methods depends on whether females or males are asked and on the handling of the use of multiple methods of contraception. (Sections 2.2 and 2.3)
3.1 Differences in Reported Contraceptive Use Between Females and Males
Sexual intercourse with someone of the opposite sex involves both females and males, so estimates based on female respondents to the NSFG and those based on male respondents to the NSFG should be similar. For the most part, the results discussed in this report do reflect similar patterns. However, there are a few noticeable differences that cannot be fully attributed to sampling error.
One difference is that the reported contraception use rate, i.e., the ratio between the number of persons using contraception during their most recent intercourse to the total number of persons at risk for unintended pregnancy during their most recent intercourse, is greater for females than for males. (Section 2.2.2)
A second, even more salient difference is that the reported prevalence of female sterilizing operations being used as a method of contraception is much higher for females than for males. (Sections 2.2.6 and 2.3.2)
There at least three hypotheses that might explain these differences, at least in part. All of them stem from the fact that those who are surveyed about sexual intercourse are surveyed not just about their own, but also about their partners’ behaviors:
- Some males might not be aware of their female partners’ contraceptive use.
- Female partners of male respondents are on average younger than male partners of female respondents.
- Those with multiple recent partners are effectively sampled with a greater probability than those who do not have multiple recent partners.
Investigation of these hypothesis is left to further research, but they are summarized in the following subsections.
3.1.1 Ignorance of Partners’ Contraceptive Use
Few males report ignorance of their partners’ contraceptive use in the NSFG. (Section 2.2.2.1) However, direct questions about this are only asked of some male respondents to the NSFG, and thus some respondents may not think to give such an answer, even if such an answer would be the most accurate description. Further, some males may not know that they do not know that their partners are using contraception. This is particularly the case for methods of contraception – such as tubal ligation, IUDs, injectables, implants, etc. – that are largely not visible to male sexual partners. The effect of this would be for males to under-report contraception use, which might explain some of the variation in both the lower contraception use rate reported by males and the lower prevalence of female sterilizing operations reported by males.
3.1.2 Younger Female Partners of Males and Older Male Partners of Females
As part of disclosure risk reduction efforts, the 2017-2019 edition of the NSFG (as well as the 2015-2017 edition) does not release age of most recent sexual partners in its public use data files. However, prior research based on previous editions of the NSFG has found that male sexual partners of females are more likely to be older, and female sexual partners of males are more likely to be younger. (Darroch, Landry, and Oslak 1999) The effect of the age asymmetry of sexual partners is that, while the age ranges of female respondents and of male respondents surveyed by the NSFG are both 15-49 years, the average age of the partners of male respondents is likely younger than the average age of the female respondents.
As seen in Section 2.9, the probability that a female has a sterilizing operation apparently increases with increasing age. Thus, the effectively older sample of females in the female respondents sample are more likely to have had sterilizing operations than the effectively younger partners of respondents in the male respondents sample. This might explain some of the difference in reported prevalence of female sterilizing operations between females and males.
3.1.3 Oversampling of Those with Multiple Recent Partners
The last sexual partner of the opposite sex within the past 3 months for one person might also be the last sexual partner of the opposite sex within the past 3 months for another person. Thus, the behavior of persons who have many recent sexual partners are effectively over-sampled in any analysis examining behavior during most recent sexual intercourse.
If the contraceptive use of those who have multiple recent sexual partners differs from the more general population and between females and males, this might explain some of the reported differences in contraceptive use between females and males. For instance, if males, but not females, who have multiple recent partners are more likely to use contraception than the general population, this would cause the contraception use rate reported by females to be greater for females than that reported by males. Similarly, if females who have multiple recent partners are less likely to have had sterilizing operations, this would cause the prevalence of female sterilizing operations reported by males to be lesser than that reported by females.
3.2 Further Research
While this report is a preliminary analysis consisting mostly of descriptive statistics, it informs further research using model-based or covariate-adjusted analyses.
The most obvious direction for further research after determining what contraceptive methods are being used is the estimation of how effective the various contraceptive methods are at preventing unintended pregnancy. Knowledge that a substantial minority of somewhere between 6 and 10 million persons use multiple methods of contraception simultaneously (Section 2.2.5) implies that such analysis should take into account use of multiple methods of contraception simultaneously. It might be the case, for instance, that condoms and pills used together are more effective than either method used separately. Another opportunity for further research, once contraceptive efficacy is established, is the analysis of covariates that explain the tendency to use less effective methods of contraception instead of more effective methods.
As noted in Section 2.4, failure to use contraception despite being at risk of unintended pregnancy appears to be in part due to inconsistent use and in part due to long-term nonuse. One opportunity for further research is the investigation of covariates that explain the probability to engage in sexual intercourse without contraception despite being at risk for unintended pregnancy. Finally, the discussion in Section 3.1 highlights the need for analyses adjusted for age as covariate in order to draw conclusions about differences in contraceptive use between females and males.
4 Citations
5 Appendix A: Technical Notes
5.1 Contraceptive Method(s) Used During Last Intercourse versus Contraceptive Status
As mentioned in Section 1.2, many similar prior works examine contraceptive use by way of current contraceptive status, which is based on respondents’ answers to the question of what contraceptive method(s) they are using during the month of the interview. These responses are encoded in variables CONSTAT1, CONSTAT2, CONSTAT3, and CONSTAT4 in the public use data files of the NSFG.
Instead of using such an approach, Section 2.2 is based on questions about what contraceptive method(s) respondents used during their most recent sexual intercourse with someone of the opposite sex, and Section 2.3 is based on questions about what contraceptive method(s) respondents used during the previous 12 months. There are several advantages to this approach:
- More detailed information is available on contraceptive use over periods of time for female respondents than for male respondents in the NSFG. In particular, male respondents are not directly asked about contraceptive use in the month of the interview, and there is no male analog of the
CONSTATseries. However, both females and males are asked about contraceptive use during their most recent intercourse and about contraceptive use during the previous 12 months. Therefore, such analysis can lead to equivalent estimates for males in addition to females. - Categorization for the
CONSTATseries is based on an exclusive prioritization, such that any individual placed in a category with higher priority is excluded from consideration from lower priority categories, and individuals are only categorized by reason for not using contraception if they are not currently using any method of contraception. Therefore, respondents who are using any long-acting contraceptive method – such as sterilizing operations, implants, injectables, IUDs – are categorized as currently using those methods even if they are not sexually active. Thus, estimates of the number of persons who are not sexually active with the opposite sex based onCONSTAT1are underestimates. - There is some measurement error in the reporting of contraceptive use over specific time periods. Some respondents who report using a method of contraception during a specific time frame, when asked about how consistently they used a method of contraception during the same time frame, report a frequency of “never.” (Section 2.4.1) Furthermore, some respondents who report not using a method of contraception during the month of the interview, when asked why not, volunteer that they are using a method of contraception during the month of the interview. (Section 2.8.2) Analysis of contraceptive use during last intercourse rather than in the current month is intended to minimize this kind of measurement error.
On the other hand, one major disadvantage of analysis of contraceptive use during last intercourse is that there is variation among respondents in how long it has been, at the time of the interview, since their last intercourse. Therefore, Section 2.2 focuses on contraceptive use during the last intercourse within the 3 months prior to the interview.
5.2 Failure to Report Sterilizing Operations as Contraceptive Methods
Some NSFG respondents reported having an active sterilizing operation, such as a tubal ligation or vasectomy, or having last had intercourse with a spouse or cohabitating partner with an active sterilizing operation, but in response to other questions do not report using said sterilizing operation as a method of contraception.
This may be due to confusion on the part of respondents with questions referring to a specific sexual encounter or to a specific period of time, since the sterilizing operations in question are likely performed well in advance of the specific encounter or time frame.
Therefore, all those who reported having an active sterilizing operation or having intercourse with a spouse or cohabitating partner with an active sterilizing operation are counted as using said sterilizing operation as a method of contraception for the appropriate encounters or time frames, even if the respondents did not themselves mention the sterilizing operation when asked about methods of contraception.
Thus, even if a respondent does not mention using a partner’s vasectomy when asked what methods were used during the last intercourse, if the respondent reports her last intercourse was with her husband and reports her husband has an active vasectomy, then the respondent is counted as using a partner’s vasectomy as a contraceptive method during last intercourse.
Similarly, even if a respondent did not mention using tubal ligation during any of the 12 months preceding the interview, if the respondent had sexual intercourse during the 12 months preceding the interview and has an active tubal ligation, then the respondent is counted as using tubal ligation as a contraceptive method during the 12 months preceding the interview.
6 Appendix B: Supplementary Tables
This appendix contains table versions of estimates that are rendered as plots in the preceding report.
6.1 Reason for Never Having Intercourse
| Total | Percentage | |||
|---|---|---|---|---|
| Est. | 95% C.I. | Est. | 95% C.I. | |
| Against religion or morals | 2.27M | (1.75M, 2.79M) | 26.1% | (21.3%, 31.0%) |
| Don't want to get pregnant | 1.56M | (1.18M, 1.94M) | 17.9% | (14.1%, 21.8%) |
| Don't want to get a sexually transmitted disease | 0.40M | (0.25M, 0.56M) | 4.6% | (2.8%, 6.5%) |
| Haven't found the right person yet | 2.29M | (1.73M, 2.85M) | 26.4% | (21.1%, 31.6%) |
| In a relationship, but waiting for the right time | 0.60M | (0.37M, 0.84M) | 6.9% | (4.3%, 9.6%) |
| Other | 1.42M | (1.02M, 1.81M) | 16.3% | (12.1%, 20.5%) |
| Refused | 0.06M | (-0.00M, 0.12M) | 0.7% | (-0.0%, 1.3%) |
| Don't know | 0.01M | (-0.00M, 0.02M) | 0.1% | (-0.0%, 0.2%) |
| No answer provided | 0.09M | (-0.07M, 0.24M) | 1.0% | (-0.8%, 2.8%) |
| Total | Percentage | |||
|---|---|---|---|---|
| Est. | 95% C.I. | Est. | 95% C.I. | |
| Against religion or morals | 2.16M | (1.63M, 2.68M) | 21.7% | (17.2%, 26.3%) |
| Don't want to get a female pregnant | 1.13M | (0.78M, 1.48M) | 11.3% | (8.4%, 14.3%) |
| Don't want to get a sexually transmitted disease | 0.40M | (0.21M, 0.59M) | 4.1% | (2.4%, 5.7%) |
| Haven't found the right person yet | 3.85M | (2.91M, 4.78M) | 38.8% | (34.0%, 43.5%) |
| In a relationship, but waiting for the right time | 0.45M | (0.31M, 0.59M) | 4.5% | (3.0%, 6.1%) |
| Other | 1.86M | (1.38M, 2.34M) | 18.7% | (15.0%, 22.5%) |
| No answer provided | 0.08M | (0.02M, 0.14M) | 0.8% | (0.2%, 1.4%) |
6.2 Reason for Physical Infertility Not Due to Sterilizing Procedure
| Total | Percentage | |||
|---|---|---|---|---|
| Est. | 95% C.I. | Est. | 95% C.I. | |
| Impossible due to problems with ovulation | 0.28M | (0.14M, 0.42M) | 12.9% | (5.5%, 20.2%) |
| Impossible due to problems with uterus, cervix, or fallopian tubes | 0.44M | (0.22M, 0.66M) | 20.5% | (12.9%, 28.2%) |
| Impossible due to other illnesses or treatment for other illnesses such as cancer | 0.46M | (0.20M, 0.72M) | 21.4% | (10.4%, 32.4%) |
| Impossible due to menopause | 0.69M | (0.34M, 1.03M) | 32.1% | (20.8%, 43.4%) |
| Impossible for other reasons | 0.25M | (0.11M, 0.40M) | 11.9% | (6.5%, 17.2%) |
| Don't know | 0.03M | (-0.02M, 0.07M) | 1.2% | (-0.7%, 3.1%) |
| Total | Percentage | |||
|---|---|---|---|---|
| Est. | 95% C.I. | Est. | 95% C.I. | |
| Impossible due to problems with sperm or semen | 0.24M | (-0.00M, 0.49M) | 60.9% | (31.0%, 90.9%) |
| Impossible due to testicular problems or varicocele | 0.03M | (-0.01M, 0.07M) | 7.4% | (-3.2%, 18.0%) |
| Impossible due to other illnesses or treatment for other illnesses | 0.12M | (0.02M, 0.21M) | 29.3% | (4.1%, 54.6%) |
| Don't know | 0.01M | (-0.01M, 0.03M) | 2.3% | (-3.2%, 7.9%) |
6.3 Method(s) Used during Most Recent Intercourse
| Total | Percentage | |||
|---|---|---|---|---|
| Est. | 95% C.I. | Est. | 95% C.I. | |
| Female sterilizing operation/tubal ligation | 10.51M | (8.78M, 12.23M) | 24.9% | (22.1%, 27.9%) |
| Condom | 9.84M | (8.45M, 11.24M) | 23.3% | (21.1%, 25.7%) |
| Pill | 7.95M | (6.59M, 9.31M) | 18.8% | (16.5%, 21.4%) |
| Withdrawal | 6.23M | (5.16M, 7.30M) | 14.8% | (13.0%, 16.7%) |
| IUD, coil, loop | 5.97M | (4.70M, 7.25M) | 14.2% | (12.2%, 16.4%) |
| Partner's vasectomy | 5.09M | (3.99M, 6.20M) | 12.1% | (10.3%, 14.1%) |
| Calendar rhythm, Standard Days, or Cycle Beads method | 1.57M | (1.14M, 2.00M) | 3.7% | (2.9%, 4.8%) |
| Implant (Norplant, Implanon, or Nexplanon) | 1.16M | (0.79M, 1.53M) | 2.8% | (2.1%, 3.6%) |
| Depo-Provera, injectables | 1.04M | (0.76M, 1.32M) | 2.5% | (1.9%, 3.3%) |
| Contraceptive ring | 0.46M | (0.29M, 0.63M) | 1.1% | (0.8%, 1.6%) |
| Safe period by temperature or cervical mucus test (Two Day, Billings Ovulation, or Sympto-thermal Method) | 0.24M | (0.05M, 0.42M) | 0.6% | (0.3%, 1.2%) |
| Contraceptive patch | 0.18M | (0.03M, 0.33M) | 0.4% | (0.2%, 1.0%) |
| Emergency contraception | 0.13M | (0.03M, 0.22M) | 0.3% | (0.1%, 0.6%) |
| Jelly or cream | 0.07M | (-0.05M, 0.19M) | 0.2% | (0.0%, 1.0%) |
| Other method | 0.04M | (-0.01M, 0.08M) | 0.1% | (0.0%, 0.3%) |
| Foam | 0.03M | (-0.02M, 0.08M) | 0.1% | (0.0%, 0.3%) |
| Suppository, insert | 0.01M | (-0.01M, 0.04M) | 0.0% | (0.0%, 0.2%) |
| Diaphragm | 0.01M | (-0.01M, 0.03M) | 0.0% | (0.0%, 0.2%) |
| Female condom, vaginal pouch | 0.00M | (-0.00M, 0.01M) | 0.0% | (0.0%, 0.0%) |
| Total | Percentage | |||
|---|---|---|---|---|
| Est. | 95% C.I. | Est. | 95% C.I. | |
| Condom | 12.05M | (10.42M, 13.67M) | 31.7% | (28.9%, 34.6%) |
| Pill | 9.63M | (8.03M, 11.23M) | 25.3% | (22.4%, 28.5%) |
| Female sterilizing operation/tubal ligation | 6.65M | (5.33M, 7.96M) | 17.5% | (14.7%, 20.7%) |
| Withdrawal | 5.65M | (4.46M, 6.84M) | 14.9% | (12.4%, 17.7%) |
| Vasectomy | 4.69M | (3.61M, 5.77M) | 12.3% | (10.0%, 15.1%) |
| IUD, coil, loop | 4.37M | (3.41M, 5.32M) | 11.5% | (9.7%, 13.5%) |
| Depo-Provera, injectables | 0.99M | (0.64M, 1.35M) | 2.6% | (1.8%, 3.7%) |
| Implant (Norplant, Implanon, or Nexplanon) | 0.89M | (0.61M, 1.18M) | 2.4% | (1.7%, 3.2%) |
| Contraceptive patch | 0.77M | (0.48M, 1.06M) | 2.0% | (1.4%, 2.9%) |
| Other method | 0.65M | (0.33M, 0.96M) | 1.7% | (1.1%, 2.8%) |
| Calendar rhythm, Standard Days, or Cycle Beads method | 0.54M | (0.30M, 0.78M) | 1.4% | (0.9%, 2.2%) |
| Contraceptive ring | 0.37M | (0.17M, 0.57M) | 1.0% | (0.6%, 1.7%) |
| Spermicidal foam, jelly, cream, film, or suppository | 0.06M | (-0.01M, 0.12M) | 0.1% | (0.0%, 0.4%) |
6.4 Method Used Exclusively during Most Recent Intercourse
| Total | Percentage | |||
|---|---|---|---|---|
| Est. | 95% C.I. | Est. | 95% C.I. | |
| Female sterilizing operation/tubal ligation | 8.42M | (6.94M, 9.90M) | 24.6% | (21.6%, 27.9%) |
| Condom | 5.88M | (4.99M, 6.77M) | 17.2% | (15.2%, 19.4%) |
| Pill | 5.26M | (4.41M, 6.11M) | 15.4% | (13.5%, 17.5%) |
| IUD, coil, loop | 5.01M | (3.96M, 6.06M) | 14.7% | (12.6%, 17.0%) |
| Withdrawal | 3.47M | (2.86M, 4.08M) | 10.1% | (8.6%, 11.9%) |
| Partner's vasectomy | 3.41M | (2.52M, 4.29M) | 10.0% | (8.1%, 12.1%) |
| Implant (Norplant, Implanon, or Nexplanon) | 0.95M | (0.63M, 1.27M) | 2.8% | (2.0%, 3.8%) |
| Depo-Provera, injectables | 0.80M | (0.53M, 1.06M) | 2.3% | (1.6%, 3.3%) |
| Calendar rhythm, Standard Days, or Cycle Beads method | 0.40M | (0.20M, 0.59M) | 1.2% | (0.7%, 1.9%) |
| Contraceptive ring | 0.29M | (0.17M, 0.40M) | 0.8% | (0.6%, 1.3%) |
| Contraceptive patch | 0.14M | (-0.01M, 0.29M) | 0.4% | (0.1%, 1.1%) |
| Jelly or cream | 0.06M | (-0.06M, 0.18M) | 0.2% | (0.0%, 1.3%) |
| Safe period by temperature or cervical mucus test (Two Day, Billings Ovulation, or Sympto-thermal Method) | 0.06M | (0.00M, 0.11M) | 0.2% | (0.1%, 0.4%) |
| Emergency contraception | 0.04M | (-0.00M, 0.09M) | 0.1% | (0.0%, 0.4%) |
| Diaphragm | 0.01M | (-0.01M, 0.03M) | 0.0% | (0.0%, 0.2%) |
| Other method | 0.01M | (-0.00M, 0.02M) | 0.0% | (0.0%, 0.1%) |
| Total | Percentage | |||
|---|---|---|---|---|
| Est. | 95% C.I. | Est. | 95% C.I. | |
| Condom | 7.02M | (5.83M, 8.21M) | 23.7% | (20.9%, 26.9%) |
| Female sterilizing operation/tubal ligation | 5.62M | (4.38M, 6.85M) | 19.0% | (15.7%, 22.9%) |
| Pill | 5.28M | (4.18M, 6.37M) | 17.8% | (15.1%, 20.9%) |
| Vasectomy | 3.55M | (2.72M, 4.38M) | 12.0% | (9.5%, 15.0%) |
| IUD, coil, loop | 3.44M | (2.61M, 4.28M) | 11.7% | (9.7%, 13.9%) |
| Withdrawal | 2.59M | (1.94M, 3.25M) | 8.8% | (6.9%, 11.0%) |
| Implant (Norplant, Implanon, or Nexplanon) | 0.66M | (0.41M, 0.91M) | 2.2% | (1.5%, 3.2%) |
| Depo-Provera, injectables | 0.58M | (0.33M, 0.83M) | 2.0% | (1.3%, 3.0%) |
| Contraceptive ring | 0.30M | (0.11M, 0.50M) | 1.0% | (0.5%, 1.9%) |
| Calendar rhythm, Standard Days, or Cycle Beads method | 0.22M | (0.03M, 0.41M) | 0.7% | (0.3%, 1.8%) |
| Other method | 0.17M | (-0.01M, 0.35M) | 0.6% | (0.2%, 1.6%) |
| Contraceptive patch | 0.11M | (0.03M, 0.19M) | 0.4% | (0.2%, 0.7%) |
| Spermicidal foam, jelly, cream, film, or suppository | 0.02M | (-0.01M, 0.05M) | 0.1% | (0.0%, 0.3%) |
6.5 Proportion of Method Users Who Also Used Other Method(s) during Most Recent Intercourse
| Total | Percentage | |||
|---|---|---|---|---|
| Est. | 95% C.I. | Est. | 95% C.I. | |
| Safe period by temperature or cervical mucus test (Two Day, Billings Ovulation, or Sympto-thermal Method) | 0.18M | (-0.07M, 0.43M) | 75.7% | (30.0%, 95.8%) |
| Calendar rhythm, Standard Days, or Cycle Beads method | 1.17M | (0.80M, 1.55M) | 74.7% | (62.5%, 83.9%) |
| Emergency contraception | 0.09M | (-0.04M, 0.21M) | 67.3% | (17.9%, 95.1%) |
| Withdrawal | 2.76M | (2.01M, 3.51M) | 44.3% | (37.5%, 51.4%) |
| Condom | 3.96M | (3.12M, 4.81M) | 40.3% | (35.0%, 45.7%) |
| Contraceptive ring | 0.17M | (0.03M, 0.31M) | 37.1% | (18.8%, 60.0%) |
| Pill | 2.69M | (1.97M, 3.40M) | 33.8% | (28.8%, 39.1%) |
| Partner's vasectomy | 1.69M | (1.18M, 2.19M) | 33.1% | (25.7%, 41.4%) |
| Contraceptive patch | 0.04M | (-0.01M, 0.10M) | 23.9% | (4.5%, 67.5%) |
| Depo-Provera, injectables | 0.25M | (0.12M, 0.37M) | 23.6% | (14.1%, 36.8%) |
| Female sterilizing operation/tubal ligation | 2.09M | (1.50M, 2.67M) | 19.9% | (15.6%, 24.9%) |
| Implant (Norplant, Implanon, or Nexplanon) | 0.21M | (0.08M, 0.34M) | 18.1% | (10.2%, 29.9%) |
| IUD, coil, loop | 0.96M | (0.60M, 1.32M) | 16.1% | (12.3%, 20.8%) |
| Total | Percentage | |||
|---|---|---|---|---|
| Est. | 95% C.I. | Est. | 95% C.I. | |
| Contraceptive patch | 0.66M | (0.37M, 0.96M) | 86.1% | (72.1%, 93.7%) |
| Other method | 0.48M | (0.22M, 0.74M) | 74.2% | (45.9%, 90.7%) |
| Calendar rhythm, Standard Days, or Cycle Beads method | 0.31M | (0.16M, 0.47M) | 58.7% | (32.5%, 80.7%) |
| Withdrawal | 3.06M | (2.35M, 3.77M) | 54.1% | (48.1%, 60.0%) |
| Pill | 4.35M | (3.48M, 5.22M) | 45.2% | (39.4%, 51.1%) |
| Condom | 5.03M | (4.11M, 5.95M) | 41.8% | (36.4%, 47.3%) |
| Depo-Provera, injectables | 0.41M | (0.22M, 0.61M) | 41.7% | (29.7%, 54.8%) |
| Implant (Norplant, Implanon, or Nexplanon) | 0.23M | (0.07M, 0.39M) | 26.2% | (13.5%, 44.7%) |
| Vasectomy | 1.14M | (0.67M, 1.61M) | 24.2% | (17.7%, 32.3%) |
| IUD, coil, loop | 0.92M | (0.59M, 1.25M) | 21.1% | (15.2%, 28.4%) |
| Contraceptive ring | 0.07M | (0.01M, 0.12M) | 17.8% | (6.5%, 40.1%) |
| Female sterilizing operation/tubal ligation | 1.03M | (0.64M, 1.43M) | 15.5% | (10.7%, 22.0%) |
6.6 Other Method(s) Used with Withdrawal, Condom, and Pill during Most Recent Intercourse
| Total | Percentage | |||
|---|---|---|---|---|
| Est. | 95% C.I. | Est. | 95% C.I. | |
| Pill | 0.89M | (0.43M, 1.34M) | 14.2% | (9.1%, 21.7%) |
| Calendar rhythm, Standard Days, or Cycle Beads method | 0.77M | (0.47M, 1.07M) | 12.4% | (8.8%, 17.1%) |
| Condom | 0.74M | (0.49M, 0.99M) | 11.9% | (8.6%, 16.2%) |
| IUD, coil, loop | 0.16M | (-0.01M, 0.32M) | 2.5% | (0.9%, 6.7%) |
| Female sterilizing operation/tubal ligation | 0.13M | (0.02M, 0.25M) | 2.1% | (0.9%, 4.8%) |
| Safe period by temperature or cervical mucus test (Two Day, Billings Ovulation, or Sympto-thermal Method) | 0.12M | (-0.05M, 0.29M) | 1.9% | (0.5%, 7.6%) |
| Contraceptive ring | 0.12M | (-0.00M, 0.24M) | 1.9% | (0.7%, 4.8%) |
| Implant (Norplant, Implanon, or Nexplanon) | 0.07M | (0.00M, 0.14M) | 1.1% | (0.4%, 2.9%) |
| Emergency contraception | 0.05M | (0.01M, 0.09M) | 0.8% | (0.4%, 1.9%) |
| Depo-Provera, injectables | 0.03M | (0.00M, 0.05M) | 0.4% | (0.2%, 1.0%) |
| Partner's vasectomy | 0.01M | (-0.01M, 0.03M) | 0.1% | (0.0%, 1.0%) |
| Jelly or cream | 0.01M | (-0.01M, 0.02M) | 0.1% | (0.0%, 0.9%) |
| Contraceptive patch | 0.01M | (-0.01M, 0.02M) | 0.1% | (0.0%, 0.9%) |
| Total | Percentage | |||
|---|---|---|---|---|
| Est. | 95% C.I. | Est. | 95% C.I. | |
| Pill | 1.38M | (0.98M, 1.77M) | 24.4% | (19.9%, 29.5%) |
| Condom | 1.21M | (0.78M, 1.64M) | 21.4% | (16.3%, 27.5%) |
| Calendar rhythm, Standard Days, or Cycle Beads method | 0.26M | (0.13M, 0.40M) | 4.7% | (2.8%, 7.8%) |
| Depo-Provera, injectables | 0.21M | (0.07M, 0.35M) | 3.8% | (2.0%, 7.0%) |
| IUD, coil, loop | 0.17M | (0.01M, 0.34M) | 3.1% | (1.2%, 7.6%) |
| Other method | 0.17M | (0.04M, 0.29M) | 2.9% | (1.4%, 6.1%) |
| Implant (Norplant, Implanon, or Nexplanon) | 0.10M | (-0.03M, 0.23M) | 1.8% | (0.5%, 6.4%) |
| Vasectomy | 0.09M | (0.01M, 0.18M) | 1.7% | (0.6%, 4.2%) |
| Contraceptive patch | 0.09M | (0.00M, 0.18M) | 1.6% | (0.6%, 4.4%) |
| Female sterilizing operation/tubal ligation | 0.04M | (-0.02M, 0.09M) | 0.7% | (0.2%, 2.6%) |
| Contraceptive ring | 0.01M | (-0.00M, 0.02M) | 0.1% | (0.0%, 0.6%) |
| Total | Percentage | |||
|---|---|---|---|---|
| Est. | 95% C.I. | Est. | 95% C.I. | |
| Pill | 1.49M | (1.09M, 1.88M) | 15.1% | (12.0%, 18.8%) |
| Withdrawal | 0.74M | (0.49M, 0.99M) | 7.5% | (5.4%, 10.3%) |
| Female sterilizing operation/tubal ligation | 0.55M | (0.33M, 0.76M) | 5.5% | (3.8%, 7.9%) |
| Calendar rhythm, Standard Days, or Cycle Beads method | 0.51M | (0.26M, 0.75M) | 5.1% | (3.3%, 8.0%) |
| IUD, coil, loop | 0.45M | (0.18M, 0.71M) | 4.6% | (2.6%, 7.8%) |
| Depo-Provera, injectables | 0.19M | (0.07M, 0.30M) | 1.9% | (1.0%, 3.5%) |
| Implant (Norplant, Implanon, or Nexplanon) | 0.13M | (0.04M, 0.22M) | 1.3% | (0.7%, 2.5%) |
| Emergency contraception | 0.05M | (-0.02M, 0.13M) | 0.5% | (0.1%, 2.2%) |
| Partner's vasectomy | 0.05M | (0.00M, 0.10M) | 0.5% | (0.2%, 1.2%) |
| Contraceptive patch | 0.04M | (-0.00M, 0.08M) | 0.4% | (0.1%, 1.1%) |
| Foam | 0.03M | (-0.02M, 0.08M) | 0.3% | (0.1%, 1.4%) |
| Other method | 0.03M | (-0.01M, 0.07M) | 0.3% | (0.1%, 1.2%) |
| Contraceptive ring | 0.03M | (-0.01M, 0.06M) | 0.3% | (0.1%, 1.0%) |
| Safe period by temperature or cervical mucus test (Two Day, Billings Ovulation, or Sympto-thermal Method) | 0.02M | (-0.01M, 0.05M) | 0.2% | (0.0%, 0.8%) |
| Suppository, insert | 0.01M | (-0.01M, 0.04M) | 0.1% | (0.0%, 1.0%) |
| Female condom, vaginal pouch | 0.00M | (-0.00M, 0.01M) | 0.0% | (0.0%, 0.2%) |
| Total | Percentage | |||
|---|---|---|---|---|
| Est. | 95% C.I. | Est. | 95% C.I. | |
| Pill | 2.86M | (2.18M, 3.55M) | 23.8% | (19.3%, 28.9%) |
| Withdrawal | 1.21M | (0.78M, 1.64M) | 10.0% | (7.5%, 13.3%) |
| IUD, coil, loop | 0.39M | (0.15M, 0.63M) | 3.3% | (1.7%, 6.1%) |
| Female sterilizing operation/tubal ligation | 0.27M | (0.07M, 0.47M) | 2.3% | (1.1%, 4.7%) |
| Depo-Provera, injectables | 0.24M | (0.09M, 0.38M) | 2.0% | (1.1%, 3.5%) |
| Vasectomy | 0.24M | (0.03M, 0.44M) | 2.0% | (0.8%, 4.6%) |
| Contraceptive patch | 0.18M | (0.05M, 0.32M) | 1.5% | (0.7%, 3.2%) |
| Other method | 0.15M | (0.02M, 0.28M) | 1.2% | (0.5%, 2.9%) |
| Implant (Norplant, Implanon, or Nexplanon) | 0.11M | (0.04M, 0.19M) | 1.0% | (0.5%, 1.8%) |
| Calendar rhythm, Standard Days, or Cycle Beads method | 0.07M | (0.00M, 0.13M) | 0.5% | (0.2%, 1.4%) |
| Contraceptive ring | 0.06M | (0.01M, 0.11M) | 0.5% | (0.2%, 1.1%) |
| Spermicidal foam, jelly, cream, film, or suppository | 0.01M | (-0.01M, 0.02M) | 0.1% | (0.0%, 0.4%) |
| Total | Percentage | |||
|---|---|---|---|---|
| Est. | 95% C.I. | Est. | 95% C.I. | |
| Condom | 1.49M | (1.09M, 1.88M) | 18.7% | (15.2%, 22.7%) |
| Withdrawal | 0.89M | (0.43M, 1.34M) | 11.2% | (7.2%, 16.9%) |
| Female sterilizing operation/tubal ligation | 0.23M | (0.03M, 0.44M) | 2.9% | (1.2%, 6.8%) |
| Partner's vasectomy | 0.16M | (0.06M, 0.26M) | 2.0% | (1.1%, 3.7%) |
| Implant (Norplant, Implanon, or Nexplanon) | 0.01M | (-0.01M, 0.04M) | 0.2% | (0.0%, 1.2%) |
| Calendar rhythm, Standard Days, or Cycle Beads method | 0.01M | (-0.01M, 0.04M) | 0.2% | (0.0%, 1.3%) |
| Emergency contraception | 0.01M | (-0.01M, 0.04M) | 0.2% | (0.0%, 1.1%) |
| Contraceptive patch | 0.00M | (-0.00M, 0.01M) | 0.0% | (0.0%, 0.3%) |
| Total | Percentage | |||
|---|---|---|---|---|
| Est. | 95% C.I. | Est. | 95% C.I. | |
| Condom | 2.86M | (2.18M, 3.55M) | 29.7% | (25.3%, 34.6%) |
| Withdrawal | 1.38M | (0.98M, 1.77M) | 14.3% | (11.0%, 18.5%) |
| Contraceptive patch | 0.29M | (0.10M, 0.49M) | 3.1% | (1.5%, 6.0%) |
| Vasectomy | 0.19M | (0.01M, 0.37M) | 1.9% | (0.7%, 4.9%) |
| Other method | 0.07M | (-0.05M, 0.18M) | 0.7% | (0.1%, 3.6%) |
| Calendar rhythm, Standard Days, or Cycle Beads method | 0.05M | (-0.01M, 0.11M) | 0.5% | (0.2%, 1.8%) |
| Female sterilizing operation/tubal ligation | 0.03M | (-0.02M, 0.08M) | 0.3% | (0.1%, 1.7%) |
| Contraceptive ring | 0.01M | (-0.01M, 0.02M) | 0.1% | (0.0%, 0.6%) |
| Implant (Norplant, Implanon, or Nexplanon) | 0.01M | (-0.01M, 0.02M) | 0.1% | (0.0%, 0.4%) |
6.7 Method(s) Used during Past 12 Months
| Total | Percentage | |||
|---|---|---|---|---|
| Est. | 95% C.I. | Est. | 95% C.I. | |
| Condom | 17.75M | (15.56M, 19.94M) | 32.2% | (30.1%, 34.3%) |
| Birth control pills | 13.44M | (11.54M, 15.34M) | 24.4% | (22.2%, 26.7%) |
| Female sterilizing operation, such as tubal sterilization and hysterectomy | 12.86M | (10.99M, 14.73M) | 23.3% | (20.9%, 25.9%) |
| Withdrawal, pulling out | 10.93M | (9.17M, 12.69M) | 19.8% | (17.7%, 22.1%) |
| IUD | 7.42M | (6.06M, 8.78M) | 13.4% | (11.8%, 15.2%) |
| Partner's vasectomy | 5.58M | (4.43M, 6.74M) | 10.1% | (8.6%, 11.8%) |
| Calendar rhythm, Standard Days, or Cycle Beads method | 2.75M | (2.13M, 3.36M) | 5.0% | (4.1%, 6.0%) |
| Depo-Provera, injectables | 2.29M | (1.85M, 2.72M) | 4.1% | (3.5%, 4.9%) |
| Hormonal implant (Norplant, Implanon, or Nexplanon) | 1.89M | (1.38M, 2.40M) | 3.4% | (2.7%, 4.3%) |
| Emergency contraception | 1.67M | (1.26M, 2.08M) | 3.0% | (2.4%, 3.7%) |
| Vaginal contraceptive ring | 0.94M | (0.58M, 1.31M) | 1.7% | (1.2%, 2.4%) |
| Safe period by temperature or cervical mucus test (Two Day, Billings Ovulation, or Sympto-thermal Method) | 0.40M | (0.16M, 0.64M) | 0.7% | (0.4%, 1.3%) |
| Contraceptive patch (Ortho-Evra or Xulane) | 0.30M | (0.13M, 0.48M) | 0.5% | (0.3%, 1.0%) |
| Other method | 0.15M | (-0.02M, 0.33M) | 0.3% | (0.1%, 0.8%) |
| Jelly or cream | 0.11M | (-0.03M, 0.26M) | 0.2% | (0.1%, 0.7%) |
| Foam | 0.04M | (-0.01M, 0.09M) | 0.1% | (0.0%, 0.2%) |
| Diaphragm | 0.03M | (-0.02M, 0.08M) | 0.1% | (0.0%, 0.3%) |
| Suppository, insert | 0.03M | (-0.01M, 0.06M) | 0.0% | (0.0%, 0.2%) |
| Female condom, vaginal pouch | 0.00M | (-0.00M, 0.01M) | 0.0% | (0.0%, 0.0%) |
| Total | Percentage | |||
|---|---|---|---|---|
| Est. | 95% C.I. | Est. | 95% C.I. | |
| Condom or rubber | 23.83M | (20.63M, 27.04M) | 49.5% | (46.5%, 52.4%) |
| Pill | 14.29M | (11.96M, 16.62M) | 29.7% | (26.8%, 32.7%) |
| Withdrawal or pulling out | 12.22M | (10.05M, 14.40M) | 25.4% | (22.3%, 28.7%) |
| Tubal sterilization or other female sterilization | 7.45M | (6.00M, 8.89M) | 15.4% | (13.0%, 18.3%) |
| IUD, coil, or loop | 5.46M | (4.29M, 6.63M) | 11.3% | (9.5%, 13.4%) |
| Vasectomy or male sterilization | 4.89M | (3.78M, 6.01M) | 10.2% | (8.2%, 12.5%) |
| Injection (Depo-Provera or Lunelle) | 1.80M | (1.27M, 2.33M) | 3.7% | (2.8%, 4.9%) |
| Rhythm or safe period | 1.74M | (1.26M, 2.21M) | 3.6% | (2.8%, 4.6%) |
| Something else | 1.61M | (1.14M, 2.08M) | 3.3% | (2.5%, 4.5%) |
| Hormonal implant (Norplant, Implanon or Nexplanon) | 1.57M | (1.15M, 2.00M) | 3.3% | (2.5%, 4.2%) |
| Vaginal contraceptive ring (Nuva Ring) | 0.86M | (0.53M, 1.19M) | 1.8% | (1.2%, 2.6%) |
| Spermicidal foam/jelly/cream/film/suppository | 0.45M | (0.21M, 0.68M) | 0.9% | (0.5%, 1.6%) |
| Contraceptive patch (Ortho-Evra) | 0.28M | (0.13M, 0.43M) | 0.6% | (0.3%, 1.0%) |
6.8 Method Used Exclusively during Past 12 Months
| Total | Percentage | |||
|---|---|---|---|---|
| Est. | 95% C.I. | Est. | 95% C.I. | |
| Female sterilizing operation, such as tubal sterilization and hysterectomy | 9.87M | (8.33M, 11.40M) | 26.6% | (23.6%, 29.8%) |
| Birth control pills | 7.14M | (5.98M, 8.30M) | 19.2% | (17.0%, 21.6%) |
| Condom | 5.99M | (5.09M, 6.90M) | 16.1% | (14.1%, 18.4%) |
| IUD | 5.09M | (4.12M, 6.05M) | 13.7% | (11.7%, 15.9%) |
| Partner's vasectomy | 3.25M | (2.35M, 4.15M) | 8.8% | (6.9%, 11.0%) |
| Withdrawal, pulling out | 2.54M | (1.90M, 3.17M) | 6.8% | (5.4%, 8.6%) |
| Depo-Provera, injectables | 1.28M | (1.02M, 1.55M) | 3.4% | (2.8%, 4.2%) |
| Hormonal implant (Norplant, Implanon, or Nexplanon) | 0.96M | (0.68M, 1.23M) | 2.6% | (1.9%, 3.4%) |
| Calendar rhythm, Standard Days, or Cycle Beads method | 0.38M | (0.17M, 0.59M) | 1.0% | (0.6%, 1.8%) |
| Vaginal contraceptive ring | 0.38M | (0.16M, 0.60M) | 1.0% | (0.6%, 1.8%) |
| Contraceptive patch (Ortho-Evra or Xulane) | 0.12M | (0.05M, 0.19M) | 0.3% | (0.2%, 0.6%) |
| Other method | 0.08M | (-0.04M, 0.20M) | 0.2% | (0.0%, 0.9%) |
| Safe period by temperature or cervical mucus test (Two Day, Billings Ovulation, or Sympto-thermal Method) | 0.07M | (0.01M, 0.13M) | 0.2% | (0.1%, 0.4%) |
| Diaphragm | 0.01M | (-0.01M, 0.03M) | 0.0% | (0.0%, 0.2%) |
| Emergency contraception | 0.01M | (-0.00M, 0.02M) | 0.0% | (0.0%, 0.1%) |
| Total | Percentage | |||
|---|---|---|---|---|
| Est. | 95% C.I. | Est. | 95% C.I. | |
| Condom or rubber | 7.99M | (6.81M, 9.16M) | 28.6% | (25.6%, 31.8%) |
| Tubal sterilization or other female sterilization | 5.54M | (4.24M, 6.83M) | 19.8% | (16.2%, 24.1%) |
| Pill | 4.04M | (3.04M, 5.04M) | 14.5% | (11.7%, 17.7%) |
| Vasectomy or male sterilization | 3.28M | (2.48M, 4.08M) | 11.8% | (9.4%, 14.7%) |
| IUD, coil, or loop | 2.81M | (2.17M, 3.45M) | 10.1% | (8.3%, 12.1%) |
| Withdrawal or pulling out | 2.24M | (1.70M, 2.79M) | 8.0% | (6.3%, 10.1%) |
| Injection (Depo-Provera or Lunelle) | 0.61M | (0.33M, 0.88M) | 2.2% | (1.4%, 3.4%) |
| Hormonal implant (Norplant, Implanon or Nexplanon) | 0.55M | (0.32M, 0.78M) | 2.0% | (1.3%, 2.9%) |
| Vaginal contraceptive ring (Nuva Ring) | 0.32M | (0.08M, 0.56M) | 1.1% | (0.5%, 2.4%) |
| Something else | 0.26M | (0.03M, 0.49M) | 0.9% | (0.4%, 2.3%) |
| Rhythm or safe period | 0.15M | (-0.03M, 0.33M) | 0.5% | (0.2%, 1.7%) |
| Spermicidal foam/jelly/cream/film/suppository | 0.07M | (-0.07M, 0.22M) | 0.3% | (0.0%, 2.0%) |
| Contraceptive patch (Ortho-Evra) | 0.07M | (0.01M, 0.13M) | 0.2% | (0.1%, 0.5%) |
6.9 Reasons for Using Pill
| Total | Percentage | |||
|---|---|---|---|---|
| Est. | 95% C.I. | Est. | 95% C.I. | |
| Birth control | 8.46M | (7.11M, 9.80M) | 76.2% | (72.0%, 79.9%) |
| To regulate your menstrual periods | 5.25M | (4.31M, 6.18M) | 47.3% | (42.3%, 52.3%) |
| Cramps, or pain during menstrual periods | 4.18M | (3.22M, 5.14M) | 37.7% | (31.9%, 43.9%) |
| To reduce menstrual bleeding | 3.50M | (2.80M, 4.20M) | 31.5% | (27.2%, 36.2%) |
| Treatment for acne | 2.50M | (1.88M, 3.12M) | 22.5% | (19.0%, 26.5%) |
| Other reasons | 1.13M | (0.69M, 1.56M) | 10.2% | (7.3%, 14.0%) |
| Treatment for hot flashes or other peri-menopausal symptoms | 0.39M | (0.13M, 0.64M) | 3.5% | (1.9%, 6.2%) |
| Treatment for endometriosis | 0.26M | (0.12M, 0.40M) | 2.3% | (1.4%, 4.0%) |
6.10 Reasons for Using Hormonal IUD
| Total | Percentage | |||
|---|---|---|---|---|
| Est. | 95% C.I. | Est. | 95% C.I. | |
| Birth control | 4.54M | (3.57M, 5.51M) | 85.8% | (80.6%, 89.7%) |
| To reduce menstrual bleeding | 1.48M | (0.99M, 1.97M) | 27.9% | (21.8%, 35.0%) |
| Cramps, or pain during menstrual periods | 1.22M | (0.72M, 1.71M) | 23.0% | (16.6%, 30.9%) |
| To regulate your menstrual periods | 1.05M | (0.64M, 1.47M) | 19.9% | (14.6%, 26.5%) |
| Other reasons | 0.39M | (0.18M, 0.60M) | 7.4% | (4.3%, 12.3%) |
| Treatment for acne | 0.10M | (0.02M, 0.19M) | 2.0% | (1.0%, 4.0%) |
| Treatment for endometriosis | 0.09M | (0.00M, 0.18M) | 1.8% | (0.7%, 4.6%) |
| Treatment for hot flashes or other peri-menopausal symptoms | 0.09M | (-0.05M, 0.23M) | 1.8% | (0.4%, 8.0%) |
6.11 Use of Contraception Ever During Lifetime
| Total | Percentage | |||
|---|---|---|---|---|
| Est. | 95% C.I. | Est. | 95% C.I. | |
| Birth control pills | 52.13M | (46.31M, 57.96M) | 71.7% | (69.5%, 73.8%) |
| Condom | 60.66M | (54.41M, 66.92M) | 83.5% | (82.0%, 84.9%) |
| Partner's vasectomy | 8.91M | (7.35M, 10.48M) | 12.3% | (10.8%, 13.8%) |
| Female sterilizing operation, such as tubal sterilization and hysterectomy | 10.78M | (9.08M, 12.47M) | 14.8% | (13.2%, 16.7%) |
| Withdrawal, pulling out | 42.21M | (37.37M, 47.06M) | 58.1% | (55.6%, 60.6%) |
| Depo-Provera, injectables | 16.22M | (14.18M, 18.27M) | 22.3% | (20.4%, 24.4%) |
| Hormonal implant (Norplant, Implanon, or Nexplanon) | 3.83M | (3.04M, 4.61M) | 5.3% | (4.5%, 6.2%) |
| Calendar rhythm, Standard Days, or Cycle Beads method | 10.39M | (9.04M, 11.73M) | 14.3% | (12.9%, 15.9%) |
| Safe period by temperature or cervical mucus test (Two Day, Billings Ovulation, or Sympto-thermal Method) | 2.34M | (1.68M, 3.00M) | 3.2% | (2.4%, 4.2%) |
| Diaphragm | 0.86M | (0.49M, 1.23M) | 1.2% | (0.8%, 1.8%) |
| Female condom, vaginal pouch | 0.57M | (0.34M, 0.79M) | 0.8% | (0.5%, 1.1%) |
| Foam | 1.79M | (1.27M, 2.30M) | 2.5% | (1.9%, 3.2%) |
| Jelly or cream | 1.40M | (1.04M, 1.76M) | 1.9% | (1.5%, 2.4%) |
| Cervical cap | 0.04M | (-0.01M, 0.09M) | 0.1% | (0.0%, 0.2%) |
| Suppository, insert | 0.81M | (0.55M, 1.06M) | 1.1% | (0.8%, 1.5%) |
| Today sponge | 0.81M | (0.55M, 1.07M) | 1.1% | (0.8%, 1.5%) |
| Emergency contraception | 16.03M | (13.79M, 18.27M) | 22.1% | (20.4%, 23.8%) |
| Other method | 0.16M | (0.04M, 0.28M) | 0.2% | (0.1%, 0.5%) |
| Lunelle | 0.16M | (-0.00M, 0.33M) | 0.2% | (0.1%, 0.6%) |
| Contraceptive patch (Ortho-Evra or Xulane) | 5.08M | (4.26M, 5.90M) | 7.0% | (6.0%, 8.1%) |
| Vaginal contraceptive ring | 6.42M | (5.04M, 7.79M) | 8.8% | (7.6%, 10.2%) |
| Copper-bearing IUD (such as Copper-T or ParaGard) | 3.79M | (2.96M, 4.62M) | 5.2% | (4.4%, 6.2%) |
| Hormonal IUD (such as Mirena, Skyla, Liletta, or Kyleena) | 10.53M | (8.75M, 12.30M) | 14.5% | (12.9%, 16.2%) |
| Other or unknown IUD | 0.30M | (0.10M, 0.51M) | 0.4% | (0.2%, 0.8%) |
| Refused | 0.01M | (-0.00M, 0.02M) | 0.0% | (0.0%, 0.0%) |
6.11.1 Among Those Who Have Ever Had Intercourse
| Total | Percentage | |||
|---|---|---|---|---|
| Est. | 95% C.I. | Est. | 95% C.I. | |
| Condom | 60.66M | (54.41M, 66.92M) | 94.8% | (93.9%, 95.7%) |
| Birth control pills | 50.45M | (44.68M, 56.22M) | 78.9% | (76.7%, 80.8%) |
| Withdrawal, pulling out | 42.21M | (37.37M, 47.06M) | 66.0% | (63.2%, 68.7%) |
| Emergency contraception | 16.03M | (13.79M, 18.27M) | 25.1% | (23.2%, 27.0%) |
| Depo-Provera, injectables | 15.97M | (13.95M, 17.99M) | 25.0% | (22.8%, 27.3%) |
| Female sterilizing operation, such as tubal sterilization and hysterectomy | 10.76M | (9.07M, 12.45M) | 16.8% | (14.9%, 18.9%) |
| Hormonal IUD (such as Mirena, Skyla, Liletta, or Kyleena) | 10.51M | (8.74M, 12.27M) | 16.4% | (14.7%, 18.3%) |
| Calendar rhythm, Standard Days, or Cycle Beads method | 10.39M | (9.04M, 11.73M) | 16.2% | (14.6%, 18.1%) |
| Partner's vasectomy | 8.91M | (7.35M, 10.48M) | 13.9% | (12.3%, 15.7%) |
| Vaginal contraceptive ring | 6.40M | (5.01M, 7.78M) | 10.0% | (8.6%, 11.6%) |
| Contraceptive patch (Ortho-Evra or Xulane) | 5.00M | (4.21M, 5.80M) | 7.8% | (6.8%, 9.0%) |
| Copper-bearing IUD (such as Copper-T or ParaGard) | 3.79M | (2.96M, 4.62M) | 5.9% | (5.0%, 7.1%) |
| Hormonal implant (Norplant, Implanon, or Nexplanon) | 3.73M | (2.96M, 4.51M) | 5.8% | (5.0%, 6.8%) |
| Safe period by temperature or cervical mucus test (Two Day, Billings Ovulation, or Sympto-thermal Method) | 2.34M | (1.68M, 3.00M) | 3.7% | (2.8%, 4.8%) |
| Foam | 1.79M | (1.27M, 2.30M) | 2.8% | (2.1%, 3.7%) |
| Jelly or cream | 1.40M | (1.04M, 1.76M) | 2.2% | (1.7%, 2.8%) |
| Diaphragm | 0.86M | (0.49M, 1.23M) | 1.3% | (0.9%, 2.0%) |
| Today sponge | 0.81M | (0.55M, 1.07M) | 1.3% | (0.9%, 1.7%) |
| Suppository, insert | 0.81M | (0.55M, 1.06M) | 1.3% | (0.9%, 1.7%) |
| Female condom, vaginal pouch | 0.56M | (0.34M, 0.79M) | 0.9% | (0.6%, 1.3%) |
| Other or unknown IUD | 0.30M | (0.10M, 0.51M) | 0.5% | (0.2%, 0.9%) |
| Lunelle | 0.16M | (-0.00M, 0.33M) | 0.3% | (0.1%, 0.7%) |
| Other method | 0.16M | (0.04M, 0.28M) | 0.2% | (0.1%, 0.5%) |
| Cervical cap | 0.04M | (-0.01M, 0.09M) | 0.1% | (0.0%, 0.2%) |
| Refused | 0.00M | (-0.00M, 0.01M) | 0.0% | (0.0%, 0.0%) |
| Don't know | 0.00M | (0.00M, 0.00M) | 0.0% | (0.0%, 0.0%) |
6.12 Discontinuation Due to Dissatisfaction
| Total | Percentage | |||
|---|---|---|---|---|
| Est. | 95% C.I. | Est. | 95% C.I. | |
| Birth control pills | 18.02M | (15.73M, 20.32M) | 34.6% | (31.9%, 37.4%) |
| Depo-Provera, injectables | 7.21M | (6.08M, 8.35M) | 44.5% | (40.4%, 48.6%) |
| Condom | 5.01M | (3.85M, 6.16M) | 8.3% | (6.8%, 9.9%) |
| Hormonal IUD (such as Mirena, Skyla, Liletta, or Kyleena) | 2.98M | (2.45M, 3.52M) | 28.3% | (24.0%, 33.1%) |
| Withdrawal, pulling out | 2.80M | (2.08M, 3.52M) | 6.6% | (5.3%, 8.3%) |
| Vaginal contraceptive ring | 2.73M | (1.96M, 3.50M) | 42.5% | (35.1%, 50.2%) |
| Contraceptive patch (Ortho-Evra or Xulane) | 2.00M | (1.53M, 2.47M) | 39.3% | (33.5%, 45.4%) |
| Hormonal implant (Norplant, Implanon, or Nexplanon) | 1.46M | (1.04M, 1.88M) | 38.2% | (31.4%, 45.6%) |
| Copper-bearing IUD (such as Copper-T or ParaGard) | 1.38M | (1.00M, 1.76M) | 36.5% | (29.2%, 44.4%) |
| Foam | 0.71M | (0.34M, 1.08M) | 39.7% | (27.2%, 53.6%) |
| Calendar rhythm, Standard Days, or Cycle Beads method | 0.60M | (0.37M, 0.83M) | 5.8% | (4.1%, 8.2%) |
| Suppository, insert | 0.32M | (0.12M, 0.52M) | 39.5% | (23.9%, 57.6%) |
| Today sponge | 0.32M | (0.14M, 0.49M) | 38.9% | (24.6%, 55.6%) |
| Diaphragm | 0.29M | (0.13M, 0.45M) | 33.5% | (19.8%, 50.6%) |
| Jelly or cream | 0.28M | (0.09M, 0.46M) | 19.6% | (10.8%, 33.1%) |
| Female condom, vaginal pouch | 0.21M | (0.04M, 0.38M) | 37.0% | (19.4%, 58.8%) |
| Safe period by temperature or cervical mucus test (Two Day, Billings Ovulation, or Sympto-thermal Method) | 0.19M | (0.02M, 0.35M) | 8.0% | (3.5%, 17.4%) |
| Lunelle | 0.12M | (-0.23M, 0.46M) | 71.9% | (5.6%, 99.1%) |
| Other or unknown IUD | 0.10M | (-0.08M, 0.27M) | 31.9% | (4.9%, 81.0%) |
| Other method | 0.06M | (-0.03M, 0.14M) | 34.5% | (10.9%, 69.5%) |
| Partner's vasectomy | 0.03M | (-0.00M, 0.06M) | 0.3% | (0.1%, 0.9%) |
| Female sterilizing operation, such as tubal sterilization and hysterectomy | 0.03M | (-0.01M, 0.06M) | 0.3% | (0.1%, 1.0%) |
6.13 Reason(s) for Discontinuation of Condom
| Total | Percentage | |||
|---|---|---|---|---|
| Est. | 95% C.I. | Est. | 95% C.I. | |
| The method decreased your sexual pleasure | 2.22M | (1.45M, 2.99M) | 44.3% | (36.5%, 52.4%) |
| Your partner did not like it | 1.84M | (1.34M, 2.35M) | 36.8% | (30.6%, 43.6%) |
| You had side effects | 1.12M | (0.67M, 1.57M) | 22.4% | (16.2%, 30.0%) |
| You worried the method would not work | 0.65M | (0.27M, 1.03M) | 13.0% | (8.1%, 20.3%) |
| Too messy | 0.54M | (0.20M, 0.88M) | 10.8% | (6.2%, 18.1%) |
| Other -- specify | 0.48M | (0.23M, 0.73M) | 9.6% | (5.9%, 15.2%) |
| The method failed, you became pregnant | 0.40M | (0.16M, 0.64M) | 8.1% | (4.8%, 13.3%) |
| Too difficult to use | 0.40M | (0.11M, 0.69M) | 7.9% | (3.9%, 15.3%) |
| Too expensive | 0.28M | (0.07M, 0.48M) | 5.5% | (2.8%, 10.8%) |
| You were worried you might have side effects | 0.10M | (-0.04M, 0.23M) | 2.0% | (0.5%, 7.3%) |
| Insurance did not cover it | 0.09M | (-0.00M, 0.19M) | 1.8% | (0.7%, 4.8%) |
| Too difficult to obtain the method | 0.08M | (0.01M, 0.16M) | 1.6% | (0.7%, 4.0%) |
| The method did not protect against disease | 0.04M | (-0.04M, 0.11M) | 0.7% | (0.1%, 4.5%) |
| Because of other health problems, a doctor told you that you should not use the method again | 0.03M | (-0.01M, 0.07M) | 0.6% | (0.2%, 2.0%) |
| Total | Percentage | |||
|---|---|---|---|---|
| Est. | 95% C.I. | Est. | 95% C.I. | |
| Allergy (latex/spermicide) | 0.75M | (0.46M, 1.05M) | 41.2% | (29.9%, 53.4%) |
| Pain/discomfort/irritation | 0.47M | (0.18M, 0.75M) | 25.7% | (17.0%, 36.9%) |
| Other (Too few cases, not classifiable elsewhere) | 0.20M | (0.04M, 0.36M) | 10.8% | (4.6%, 23.3%) |
| Didn't like it / Didn't like how it felt | 0.17M | (0.07M, 0.28M) | 9.5% | (5.5%, 15.9%) |
| Inconvenient | 0.12M | (0.03M, 0.21M) | 6.6% | (2.9%, 14.6%) |
| Yeast infection | 0.10M | (-0.04M, 0.25M) | 5.7% | (1.5%, 19.1%) |
| Not ascertained | 0.08M | (-0.02M, 0.17M) | 4.1% | (1.2%, 12.8%) |
| Frustrating to use | 0.07M | (-0.00M, 0.14M) | 3.7% | (1.4%, 9.4%) |
| Not spontaneous | 0.02M | (-0.01M, 0.05M) | 1.2% | (0.3%, 5.1%) |
| Worried it would fall off / break / not prevent pregnancy | 0.02M | (0.00M, 0.04M) | 1.1% | (0.4%, 2.6%) |
6.14 Reason(s) for Discontinuation of Pill
| Total | Percentage | |||
|---|---|---|---|---|
| Est. | 95% C.I. | Est. | 95% C.I. | |
| You had side effects | 11.44M | (9.58M, 13.29M) | 63.5% | (58.8%, 67.9%) |
| Too difficult to use | 2.97M | (2.30M, 3.64M) | 16.5% | (13.8%, 19.5%) |
| Did not like the changes to your menstrual cycle | 2.39M | (1.75M, 3.02M) | 13.3% | (10.9%, 16.0%) |
| Other -- specify | 1.87M | (1.45M, 2.29M) | 10.4% | (8.5%, 12.6%) |
| You were worried you might have side effects | 1.72M | (1.20M, 2.25M) | 9.5% | (7.5%, 12.1%) |
| The method failed, you became pregnant | 1.30M | (0.95M, 1.66M) | 7.2% | (5.6%, 9.3%) |
| Because of other health problems, a doctor told you that you should not use the method again | 1.20M | (0.75M, 1.66M) | 6.7% | (4.6%, 9.5%) |
| You worried the method would not work | 0.99M | (0.54M, 1.44M) | 5.5% | (3.6%, 8.3%) |
| Too difficult to obtain the method | 0.65M | (0.32M, 0.99M) | 3.6% | (2.2%, 5.8%) |
| The method decreased your sexual pleasure | 0.60M | (0.34M, 0.85M) | 3.3% | (2.2%, 5.0%) |
| Too expensive | 0.56M | (0.23M, 0.89M) | 3.1% | (1.8%, 5.5%) |
| The method did not protect against disease | 0.37M | (0.16M, 0.58M) | 2.1% | (1.2%, 3.5%) |
| Insurance did not cover it | 0.36M | (0.18M, 0.54M) | 2.0% | (1.3%, 3.2%) |
| Your partner did not like it | 0.14M | (-0.03M, 0.32M) | 0.8% | (0.3%, 2.4%) |
| Too messy | 0.03M | (-0.00M, 0.07M) | 0.2% | (0.1%, 0.5%) |
| Refused | 0.00M | (0.00M, 0.00M) | 0.0% | (0.0%, 0.0%) |
| Don't know | 0.00M | (0.00M, 0.00M) | 0.0% | (0.0%, 0.0%) |
| Total | Percentage | |||
|---|---|---|---|---|
| Est. | 95% C.I. | Est. | 95% C.I. | |
| Mood swings/depression | 4.36M | (3.27M, 5.44M) | 29.0% | (24.5%, 33.9%) |
| Can't remember to take pill (regularly) | 3.73M | (2.93M, 4.53M) | 24.8% | (21.2%, 28.8%) |
| Weight gain | 3.59M | (2.87M, 4.32M) | 23.9% | (19.9%, 28.4%) |
| Nausea/sickness | 2.45M | (1.80M, 3.10M) | 16.3% | (13.4%, 19.7%) |
| Headaches/migraines | 1.93M | (1.42M, 2.44M) | 12.8% | (10.0%, 16.3%) |
| Other side effects | 1.66M | (1.27M, 2.05M) | 11.1% | (8.7%, 14.0%) |
| Bleeding problems (spotting, too much, irregularly) | 1.64M | (1.26M, 2.02M) | 10.9% | (9.1%, 13.0%) |
| Skin problems | 0.78M | (0.48M, 1.08M) | 5.2% | (3.7%, 7.2%) |
| Menstrual cramps | 0.71M | (0.40M, 1.01M) | 4.7% | (3.1%, 7.0%) |
| Didn't like/Didn't want to use | 0.51M | (0.28M, 0.74M) | 3.4% | (2.2%, 5.2%) |
| Hormonal problems/changes | 0.41M | (0.25M, 0.57M) | 2.7% | (1.9%, 3.9%) |
| Concerns about risks, such as breast cancer | 0.38M | (0.15M, 0.62M) | 2.6% | (1.4%, 4.7%) |
| Other (Too few cases, not classifiable elsewhere) | 0.34M | (0.17M, 0.51M) | 2.3% | (1.4%, 3.6%) |
| Fatigue | 0.29M | (0.15M, 0.42M) | 1.9% | (1.2%, 3.0%) |
| Dizziness | 0.27M | (0.09M, 0.45M) | 1.8% | (0.9%, 3.5%) |
| Decreased sex drive | 0.26M | (0.09M, 0.43M) | 1.7% | (0.9%, 3.2%) |
| High blood pressure | 0.17M | (-0.02M, 0.36M) | 1.1% | (0.4%, 3.4%) |
| Blood clots | 0.12M | (0.02M, 0.22M) | 0.8% | (0.4%, 1.7%) |
| Weight loss | 0.11M | (0.03M, 0.19M) | 0.7% | (0.3%, 1.5%) |
| Leg cramps | 0.09M | (0.00M, 0.19M) | 0.6% | (0.2%, 1.7%) |
| Hair loss | 0.09M | (0.03M, 0.16M) | 0.6% | (0.3%, 1.2%) |
| Not ascertained | 0.04M | (-0.01M, 0.09M) | 0.3% | (0.1%, 0.9%) |
| Interfered with other medications | 0.03M | (-0.00M, 0.06M) | 0.2% | (0.1%, 0.5%) |
| Not effective at preventing cramps | 0.03M | (-0.03M, 0.08M) | 0.2% | (0.0%, 1.4%) |
| Refused | 0.00M | (0.00M, 0.00M) | 0.0% | (0.0%, 0.0%) |
| Don't know | 0.00M | (0.00M, 0.00M) | 0.0% | (0.0%, 0.0%) |
6.15 Reason(s) for Discontinuation of IUD
| Total | Percentage | |||
|---|---|---|---|---|
| Est. | 95% C.I. | Est. | 95% C.I. | |
| You had side effects | 2.99M | (2.38M, 3.61M) | 65.3% | (57.2%, 72.6%) |
| Other -- specify | 0.95M | (0.58M, 1.32M) | 20.8% | (14.6%, 28.8%) |
| Did not like the changes to your menstrual cycle | 0.85M | (0.54M, 1.16M) | 18.5% | (13.8%, 24.3%) |
| Because of other health problems, a doctor told you that you should not use the method again | 0.43M | (0.24M, 0.63M) | 9.4% | (6.3%, 14.0%) |
| The method decreased your sexual pleasure | 0.28M | (0.15M, 0.40M) | 6.1% | (4.0%, 9.1%) |
| Your partner did not like it | 0.26M | (0.14M, 0.38M) | 5.6% | (3.5%, 8.9%) |
| You were worried you might have side effects | 0.22M | (0.09M, 0.36M) | 4.9% | (2.7%, 8.7%) |
| The method failed, you became pregnant | 0.15M | (0.00M, 0.30M) | 3.3% | (1.2%, 8.5%) |
| Insurance did not cover it | 0.08M | (-0.01M, 0.16M) | 1.7% | (0.6%, 4.9%) |
| Too messy | 0.07M | (0.01M, 0.14M) | 1.6% | (0.7%, 4.0%) |
| Too difficult to use | 0.05M | (0.01M, 0.08M) | 1.0% | (0.4%, 2.2%) |
| You worried the method would not work | 0.04M | (-0.01M, 0.10M) | 1.0% | (0.3%, 3.3%) |
| Too difficult to obtain the method | 0.02M | (-0.00M, 0.04M) | 0.5% | (0.2%, 1.3%) |
| The method did not protect against disease | 0.02M | (-0.00M, 0.04M) | 0.5% | (0.1%, 1.4%) |
| Too expensive | 0.01M | (-0.01M, 0.03M) | 0.2% | (0.0%, 1.8%) |
| Total | Percentage | |||
|---|---|---|---|---|
| Est. | 95% C.I. | Est. | 95% C.I. | |
| Abdominal pain or cramping; back pain | 1.40M | (1.04M, 1.76M) | 36.4% | (30.3%, 43.1%) |
| Other side effects | 1.04M | (0.71M, 1.38M) | 27.2% | (21.3%, 34.1%) |
| Bleeding problems (spotting, too much, irregularly) | 0.96M | (0.68M, 1.25M) | 25.2% | (19.4%, 31.9%) |
| IUD moved or was expelled | 0.51M | (0.34M, 0.69M) | 13.4% | (9.5%, 18.5%) |
| Mood swings/depression | 0.32M | (0.18M, 0.47M) | 8.5% | (5.5%, 12.8%) |
| Other (Too few cases, not classifiable elsewhere) | 0.28M | (0.09M, 0.47M) | 7.2% | (3.5%, 14.1%) |
| Headaches/migraines | 0.26M | (0.06M, 0.46M) | 6.8% | (3.4%, 13.1%) |
| Pain or discomfort during intercourse | 0.24M | (0.03M, 0.45M) | 6.2% | (2.6%, 14.3%) |
| Weight gain | 0.21M | (0.10M, 0.33M) | 5.5% | (3.2%, 9.5%) |
| Skin problems | 0.17M | (0.00M, 0.34M) | 4.5% | (1.7%, 11.6%) |
| Vaginal infection | 0.15M | (0.06M, 0.24M) | 3.9% | (2.1%, 7.0%) |
| Nausea/sickness | 0.11M | (0.00M, 0.23M) | 3.0% | (1.1%, 7.6%) |
| Hair loss or growth | 0.10M | (-0.01M, 0.21M) | 2.6% | (0.9%, 7.4%) |
| Not ascertained | 0.06M | (-0.06M, 0.17M) | 1.5% | (0.2%, 10.2%) |
6.16 Reason(s) for Nonuse When Not Intending to Conceive
| Total | Percentage | |||
|---|---|---|---|---|
| Est. | 95% C.I. | Est. | 95% C.I. | |
| You do not think you can get pregnant | 1.06M | (0.80M, 1.32M) | 34.4% | (27.0%, 42.6%) |
| You are worried about the side effects of birth control | 0.92M | (0.52M, 1.31M) | 29.7% | (21.1%, 40.0%) |
| You don't really mind if you get pregnant | 0.64M | (0.42M, 0.87M) | 20.9% | (14.7%, 28.8%) |
| You do not expect to have sex | 0.54M | (0.34M, 0.75M) | 17.7% | (12.7%, 24.1%) |
| If volunteered: Respondent is using a method | 0.26M | (0.05M, 0.47M) | 8.5% | (3.9%, 17.4%) |
| You could not get a method | 0.13M | (-0.02M, 0.27M) | 4.2% | (1.3%, 12.2%) |
| You are not taking, or using, your method consistently | 0.11M | (0.03M, 0.20M) | 3.7% | (1.8%, 7.6%) |
| Don't know | 0.06M | (-0.01M, 0.14M) | 2.1% | (0.7%, 6.4%) |
| Your male partner does not want you to use a birth control method | 0.06M | (-0.00M, 0.13M) | 2.1% | (0.7%, 5.7%) |
| Your male partner himself does not want to use a birth control method | 0.06M | (-0.01M, 0.13M) | 2.0% | (0.6%, 6.2%) |
6.17 Reason(s) Respondent Believes She Cannot Become Pregnant
| Total | Percentage | |||
|---|---|---|---|---|
| Est. | 95% C.I. | Est. | 95% C.I. | |
| Menopause related | 0.20M | (0.08M, 0.32M) | 18.7% | (9.9%, 32.5%) |
| Diagnosis of repro problems/condition | 0.18M | (0.08M, 0.28M) | 16.7% | (9.8%, 27.0%) |
| Too old (R or partner) | 0.14M | (0.01M, 0.26M) | 12.9% | (5.2%, 28.4%) |
| Partner sterile | 0.13M | (0.04M, 0.23M) | 12.7% | (6.3%, 23.9%) |
| Perceive infertile or difficulty getting preg/carrying to term | 0.12M | (0.00M, 0.23M) | 11.0% | (4.1%, 26.5%) |
| Prior unprotected sex, no preg | 0.11M | (0.02M, 0.21M) | 10.8% | (4.9%, 22.3%) |
| Breastfeeding | 0.08M | (-0.01M, 0.16M) | 7.1% | (2.3%, 20.1%) |
| No menstrual cycle or menstrual irregularity | 0.06M | (-0.00M, 0.13M) | 6.1% | (2.2%, 15.9%) |
| Other | 0.05M | (-0.02M, 0.13M) | 5.0% | (1.3%, 17.7%) |
| One ovary/fallopian tube/low or no ovulation | 0.04M | (-0.02M, 0.11M) | 4.1% | (1.0%, 15.6%) |
| Prior preg or attempt: problems with or treatments/ART needed | 0.04M | (-0.00M, 0.09M) | 3.8% | (1.2%, 11.1%) |
| Not having sex | 0.03M | (-0.00M, 0.06M) | 2.9% | (1.0%, 7.7%) |
| Not ascertained | 0.01M | (-0.01M, 0.02M) | 0.7% | (0.1%, 5.3%) |
7 Footnotes
While this is a novel approach for the topic of contraceptive use generally based on the NSFG, this approach has been used for other data sources (Bensyl et al. 2005) and for more specific contraceptive methods such as condoms (Copen 2017).↩︎
The “M” in the figures refers to “millions,” such that “15.2M persons” describes approximately fifteen million, two hundred thousand persons.↩︎
The phrase “95% C.I.” refers to a 95% confidence interval.↩︎
As of the writing of this report, the full results of the 2020 U.S. Census have not been released. Therefore, the 2010 Census is used. Census counts from 2010 can be expected to be lesser than what would have been the census counts from the 2017-2019 time frame, if there was any population growth between 2010 and 2017.↩︎
Furthermore, the point estimates of population size based on the NSFG are quite close to the census counts, though the census counts are more than a million persons greater for both females and males. Unlike the NSFG estimates, the U.S. Census does count those without a current residential address and those living in group housing, which might account for these differences.↩︎
Separating out estimates of those who are pregnant or postpartum is not possible over extended periods of time such as 12 months when using the NSFG’s public use data files, since the months that pregnancies begin and end are not released for disclosure risk reduction.↩︎
Here “average” refers to the arithmetic mean.↩︎